Blog
Antarctic Ice Melt: What Happens If All Ice Sheets Collapse?

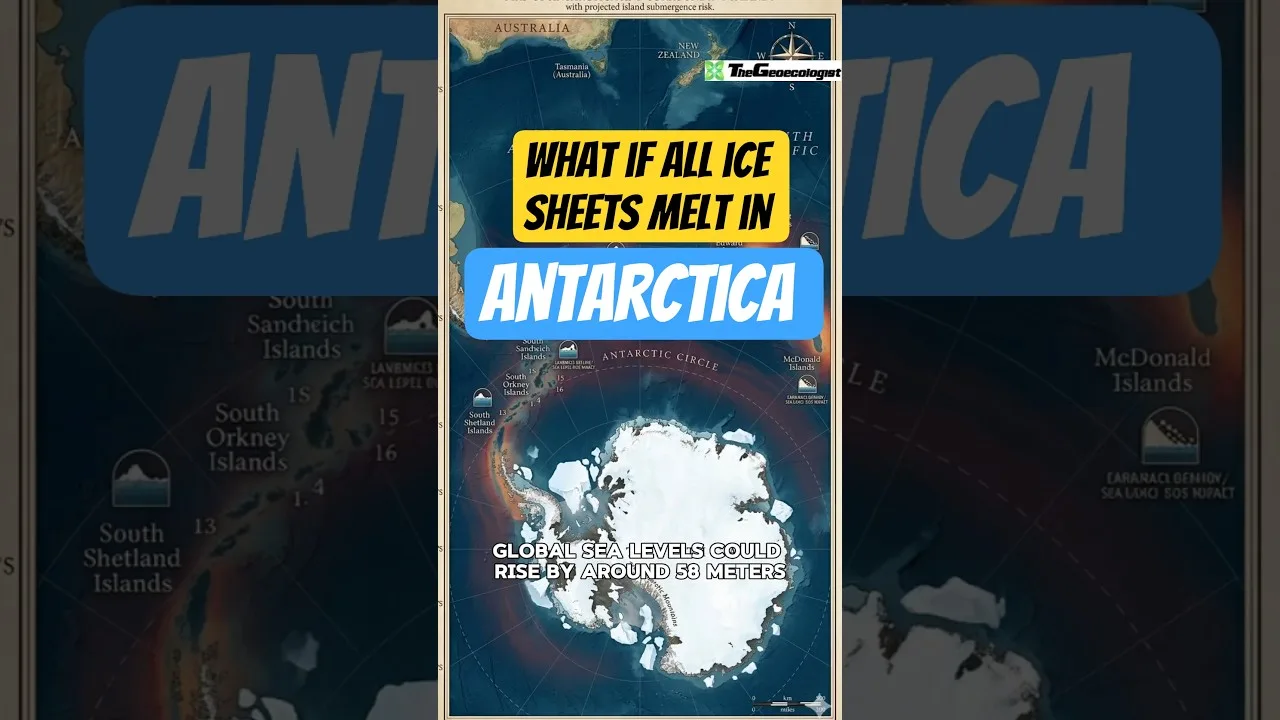
Table of Contents
- The Staggering Scale of Antarctic Ice
- Projected Sea Level Rise from Antarctic Ice Melt
- Cities at Risk from Rising Oceans
- Megacities on the Front Lines
- Island Nations Facing Extinction
- Humanitarian Crisis and Mass Migration
- Timeline: How Fast Could Antarctic Ice Melt Happen?
- Centuries to Millennia for Total Collapse
- Near-Term Decisions, Long-Term Consequences
- Feedback Loops and Global Climate Impacts
- Economic Consequences of Coastal Inundation
- Can We Prevent Catastrophic Antarctic Ice Melt?
- What Individuals Can Do
- Conclusion: The Choice Before Us
The prospect of total Antarctic ice melt represents one of the most profound existential threats facing human civilization. Antarctica, often dismissed as a remote frozen desert, functions as Earth’s primary climate thermostat and freshwater reservoir. Containing approximately 70% of the planet’s freshwater and 90% of its ice, the continent’s stability underpins the geographic and climatic conditions that have allowed human society to flourish for millennia. As atmospheric carbon dioxide concentrations surpass 420 parts per million—levels unseen in at least 3 million years—the question of what happens if all Antarctic ice sheets melt transitions from scientific speculation to urgent policy imperative.
- Sea level rise: Complete Antarctic ice melt would raise global oceans by ~58 meters (190 feet), redrawing every coastline on Earth.
- Urban inundation: Major cities including New York, London, Tokyo, Shanghai, Mumbai, and Sydney would be largely submerged.
- Nation extinction: Low-lying island nations like the Maldives, Kiribati, Tuvalu, and the Marshall Islands would cease to exist as sovereign territory.
- Displacement scale: 400–600 million people currently live in areas that would be underwater, triggering unprecedented humanitarian migration.
- Timeline reality: Total collapse requires centuries to millennia, but irreversible commitment to multi-meter rise may occur this century.
- Feedback loops: Ice loss reduces planetary albedo, accelerating warming in a self-reinforcing cycle that affects global weather patterns.
The Staggering Scale of Antarctic Ice
To comprehend the magnitude of potential Antarctic ice melt, one must first grasp the sheer volume of ice involved. The Antarctic Ice Sheet covers 14 million square kilometers—an area larger than the United States and Mexico combined. Its average thickness exceeds 2.16 kilometers, with maximum depths reaching 4.8 kilometers in places like the Astrolabe Subglacial Basin. The total ice volume approaches 26.5 million cubic kilometers. If melted, this single ice sheet contains enough water to raise global mean sea level by 57.9 meters, according to the most recent BedMachine Antarctica topography dataset published in Nature Geoscience (2020).
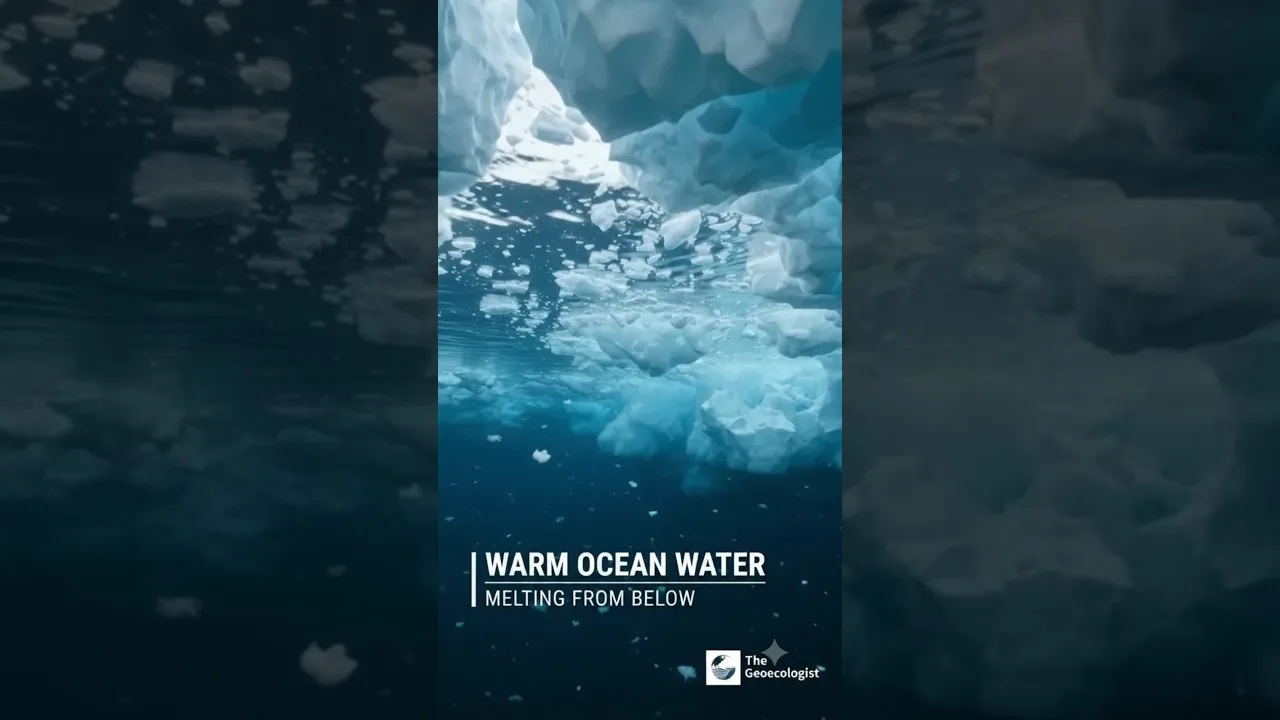
The ice sheet comprises two distinct components: the East Antarctic Ice Sheet (EAIS), which holds approximately 52 meters of sea-level equivalent and sits mostly on bedrock above sea level, and the West Antarctic Ice Sheet (WAIS), holding roughly 5 meters of sea-level equivalent but grounded largely below sea level, making Antarctic ice melt inherently less stable. The Antarctic Peninsula, though smaller, has experienced the most rapid warming and ice shelf collapse in recent decades. Understanding these distinctions is critical because Antarctic ice melt will not proceed uniformly; marine-based sectors like WAIS are vulnerable to rapid, potentially irreversible retreat driven by warm ocean currents melting ice shelves from below.
Projected Sea Level Rise from Antarctic Ice Melt
The Intergovernmental Panel on Climate Change (IPCC) Sixth Assessment Report (AR6) provides the authoritative scientific consensus on sea-level projections. Under the highest-emission scenario (SSP5-8.5), the IPCC projects 0.63–1.01 meters of global mean sea-level rise by 2100, with a low-likelihood, high-impact possibility of up to 2 meters if marine ice cliff instability initiates widespread WAIS collapse. By 2300, the same scenario yields 1.7–6.8 meters, with deep uncertainty extending beyond 15 meters if Antarctic ice melt accelerates beyond current model parameterizations.
These projections exclude the full 58-meter potential because complete Antarctic ice melt operates on millennial timescales. Paleoclimate evidence from the Pliocene (3 million years ago, CO₂ ~400 ppm) and the Last Interglacial (125,000 years ago, temperatures ~1°C above pre-industrial) shows sea levels 10–25 meters higher than today, implying substantial Antarctic contribution. The critical policy question is not whether the full 58 meters will occur in our lifetimes, but whether we are committing future centuries to irreversible ice loss through emissions decisions made today.
Cities at Risk from Rising Oceans
Megacities on the Front Lines
A 2019 study in Nature Communications by Climate Central researchers, using improved coastal elevation data (CoastalDEM), revealed that previous assessments underestimated exposure by a factor of three. Under a 1-meter rise scenario—plausible by 2100 under high emissions—land currently home to 230 million people falls below the high-tide line. At 2 meters, that figure exceeds 300 million. A full Antarctic ice melt scenario of 58 meters would inundate land housing over 1 billion people.
Consider the specific vulnerabilities:
- Shanghai (24 million metro population): Built on the Yangtze River Delta, average elevation 4 meters. Subsidence from groundwater extraction compounds marine inundation.
- Mumbai (20 million): Coastal megacity with extensive reclaimed land at sea level; monsoon flooding already causes annual economic losses exceeding $1 billion.
- New York City (8.8 million): Hurricane Sandy (2012) demonstrated vulnerability; 1 meter rise makes Sandy-level flooding occur every 5 years instead of every 500.
- Tokyo (37 million metro): Extensive subsidence (up to 4 meters in places) plus typhoon exposure; $1.5 trillion in assets at risk.
- London (9 million): Thames Barrier designed for 1-in-1000-year event; 0.5 meter rise reduces protection to 1-in-10-year by 2100.
These cities represent nodes in the global economic network. Their simultaneous degradation would cascade through supply chains, financial markets, and geopolitical stability in ways no single disaster has ever tested.
Island Nations Facing Extinction

The existential threat of Antarctic ice melt falls most acutely on atoll nations. The Republic of Kiribati (population ~120,000, average elevation 2 meters), Tuvalu (~11,000, average 2 meters), the Marshall Islands (~59,000, average 2 meters), and the Maldives (~540,000, average 1.5 meters) face not merely economic disruption but the legal and cultural erasure of sovereign statehood. International law currently lacks a framework for “deterritorialized states”—nations that lose all habitable land but retain populations and cultural continuity.
Kiribati has purchased 2,200 hectares in Fiji as a potential relocation site, while Tuvalu has pursued digital nationhood, creating a virtual replica of its territory in the metaverse to preserve sovereignty claims. The Marshall Islands faces the additional burden of nuclear testing legacy (Runit Dome), where rising seas threaten to mobilize radioactive contamination. These nations contribute negligibly to global emissions (<0.03% combined) yet bear the earliest and most irreversible consequences of Antarctic ice melt driven by industrialized nations’ historical emissions.
Humanitarian Crisis and Mass Migration
The World Bank’s 2021 “Groundswell” report projects up to 216 million internal climate migrants by 2050 across six regions, with sea-level rise as a primary driver. Cross-border migration adds legal complexity: the 1951 Refugee Convention does not recognize climate displacement as grounds for asylum. The UN Human Rights Committee’s 2020 ruling in Teitiota v. New Zealand acknowledged that climate impacts may trigger non-refoulement obligations, but stopped short of establishing a binding precedent.
A 58-meter Antarctic ice melt scenario would displace populations equivalent to the current combined populations of North America and Europe. Receiving regions—typically inland, higher-elevation areas—would face unprecedented pressure on water, food, housing, and governance systems. Historical analogs (Partition of India, Syrian displacement) involved 10–15 million people; we lack institutional capacity for orderly migration at 100x that scale. Conflict risk rises sharply when resource scarcity intersects with identity politics and weak governance—a dynamic the Pentagon has classified as a “threat multiplier” since its 2014 Quadrennial Defense Review.
Timeline: How Fast Could Antarctic Ice Melt Happen?
Centuries to Millennia for Total Collapse
Physical constraints dictate that complete Antarctic ice melt cannot occur rapidly. Melting 26.5 million km³ of ice requires ~8.8 × 10²¹ joules of energy—equivalent to ~21,000 years of current total global primary energy consumption. Even with extreme radiative forcing, thermal inertia of the ice sheet and the latent heat of fusion impose minimum timescales of several centuries for WAIS and millennia for EAIS.
However, “commitment” differs from “completion.” Marine Ice Sheet Instability (MISI) and Marine Ice Cliff Instability (MICI) mechanisms could initiate self-sustaining retreat that becomes irreversible on human timescales once triggered. The Thwaites Glacier—dubbed the “Doomsday Glacier”—exemplifies this risk. Its grounding line retreats into deeper bedrock basins, allowing warm Circumpolar Deep Water to access ever-larger ice-ocean interfaces. The International Thwaites Glacier Collaboration (ITGC) estimates Thwaites alone could contribute 65 cm to sea-level rise over centuries, but its collapse could destabilize the entire WAIS, unlocking 3+ meters.
Near-Term Decisions, Long-Term Consequences
The IPCC AR6 emphasizes that sea-level rise through 2050 is largely “locked in” by past emissions (0.15–0.23 m regardless of scenario). Post-2050 divergence is dramatic: low-emission scenarios (SSP1-2.6) limit 2100 rise to 0.38–0.77 m, while high-emission scenarios risk 0.63–1.01 m with low-likelihood >2 m outcomes. The Antarctic ice melt contribution dominates this uncertainty. Every 0.1°C of avoided warming reduces committed ice loss; the difference between 1.5°C and 2°C pathways translates to roughly 10 cm less sea-level rise by 2100 and potentially meters less by 2300.
Feedback Loops and Global Climate Impacts
The consequences of Antarctic ice melt extend far beyond coastlines. The ice sheet’s high albedo (~0.8) reflects ~80% of incident solar radiation; open ocean absorbs ~90%. As ice retreats, the planetary energy imbalance worsens—a positive feedback estimated at 0.3–1.1 W/m² per meter of sea-level equivalent lost from Antarctica. Additionally, freshwater flux from melting disrupts Antarctic Bottom Water (AABW) formation, the densest water mass driving the global meridional overturning circulation (AMOC).
A 2023 study in Nature by Li et al. found AABW formation has slowed ~30% since the 1990s, with projections of 40–50% slowdown by 2050 under high emissions. This weakens the ocean’s capacity to sequester heat and carbon, accelerating atmospheric warming globally. Altered Southern Ocean stratification also reduces nutrient upwelling, threatening the base of the Antarctic food web (krill, phytoplankton) and the fisheries and carbon export they support. These teleconnections mean Antarctic ice melt reshapes climate in the tropics, the North Atlantic, and the Asian monsoon systems—not just at high latitudes.
Economic Consequences of Coastal Inundation
The OECD estimates that without adaptation, annual flood damages in the world’s 136 largest coastal cities could reach $1 trillion by 2050 (up from $6 billion in 2005). With optimal adaptation (dikes, nourishment, zoning), residual damages fall to ~$60 billion annually but require $50–200 billion/year in investment. These figures assume ~0.5 m rise by 2050; a 2-meter scenario multiplies costs non-linearly as protection becomes physically or financially infeasible for many regions.
Insurance markets are already retreating. Florida’s Citizens Property Insurance Corporation became the state’s largest insurer after private carriers exited; similar dynamics affect Louisiana, California (wildfire), and Australia (flood). Reinsurers (Munich Re, Swiss Re) explicitly price climate risk into catastrophe bonds. Credit rating agencies (Moody’s, S&P) now incorporate sea-level exposure into sovereign and municipal ratings. The financial system is pricing Antarctic ice melt risk decades before the physical inundation peaks—a market signal that adaptation and mitigation investments are overdue.
Can We Prevent Catastrophic Antarctic Ice Melt?
The scientific consensus is unambiguous: limiting warming to 1.5°C (Paris Agreement aspirational goal) requires global net-zero CO₂ emissions by ~2050, with 45% reductions by 2030 relative to 2010. Current Nationally Determined Contributions (NDCs) under the Paris Agreement put the world on track for ~2.7°C by 2100—well into the range where WAIS collapse becomes likely and EAIS vulnerability increases. The 2023 Global Stocktake at COP28 acknowledged the “emissions gap” and called for “transitioning away from fossil fuels,” but policy implementation lags rhetoric.
Geoengineering proposals—marine cloud brightening, stratospheric aerosol injection, seabed curtains to block warm water—remain speculative, carry governance and termination risks, and do not address ocean acidification. The only robust pathway to limit Antarctic ice melt is rapid decarbonization: phasing out coal by 2030 (OECD) / 2040 (global), ending deforestation, scaling carbon dioxide removal (CDR) to gigaton-scale by mid-century, and reducing methane 30% by 2030 (Global Methane Pledge). The International Energy Agency’s Net Zero by 2050 roadmap provides a sector-by-sector benchmark; current investment in clean energy ($1.7 trillion in 2023) must triple to $4.5 trillion annually by 2030.
What Individuals Can Do
While systemic change requires policy, individual actions aggregate to political and market signals. High-impact personal choices (per Wynes & Nicholas 2017, Environmental Research Letters): having fewer children (58.6 tCO₂e/year per child in developed nations), living car-free (2.4 tCO₂e/year), avoiding one transatlantic flight (1.6 tCO₂e), buying green energy (1.5 tCO₂e/year), and adopting plant-based diets (0.8 tCO₂e/year). Civic engagement—voting, contacting representatives, supporting climate litigation (e.g., Urgenda v. Netherlands, Juliana v. US), divesting from fossil fuels—amplifies individual leverage. The Antarctic ice melt trajectory will be determined by collective emissions this decade; every fraction of a degree matters.
Conclusion: The Choice Before Us
The fate of the Antarctic Ice Sheet is not a distant abstraction—it is a ledger of decisions made today. The 58 meters of potential sea-level rise from total Antarctic ice melt represents the outer boundary of a future we can still avoid. The 0.5–1 meter likely this century represents the future we have already chosen through past inaction. The gap between those futures—measured in trillions of dollars, hundreds of millions of displaced lives, and the survival of nations—is the space where policy, innovation, and moral courage operate.
Antarctica’s ice has persisted for 34 million years, through orbital cycles and CO₂ fluctuations. Its current destabilization is a direct consequence of the 1.2°C warming since 1850, driven by 2.5 trillion tonnes of cumulative CO₂ emissions. Stabilizing the climate at 1.5°C preserves most of the ice sheet; 3°C likely commits West Antarctica to collapse and initiates East Antarctic vulnerability. The physics is settled. The economics are favorable (mitigation costs ~1–2% GDP vs. damages ~10–20% GDP). The technology exists. What remains is the political will to act at the scale the ice sheet’s inertia demands.
Protecting Antarctica is not about saving penguins or preserving a wilderness aesthetic—though both matter. It is about defending the geographic stability that underpins human civilization. The ice sheet does not negotiate. It responds only to the energy balance we impose. The time to shift that balance is now.
NASA Vital Signs: Ice Sheets provides real-time satellite observations of Antarctic mass balance. The IPCC AR6 Working Group I Report remains the definitive scientific assessment. For interactive sea-level visualization, see NOAA Sea Level Rise Viewer.
Frequently Asked Questions
Complete Antarctic ice melt would raise global mean sea level by approximately 58 meters (190 feet), according to BedMachine Antarctica data published in Nature Geoscience (2020). This includes ~52 meters from the East Antarctic Ice Sheet and ~5 meters from the West Antarctic Ice Sheet.
Total Antarctic ice melt would take centuries to millennia due to the immense thermal inertia of the ice sheet (26.5 million km³). However, irreversible commitment to multi-meter sea-level rise from West Antarctic collapse could be triggered this century under high-emission scenarios.
Shanghai, Mumbai, New York City, Tokyo, London, Jakarta, Lagos, Bangkok, Miami, and Alexandria face severe inundation risk. A 2019 Climate Central study using improved elevation data found 300 million people currently live on land threatened by 2-meter sea-level rise.