Blog
Demographic Transition Theory: Notestein’s Model Explained for UPSC Geography

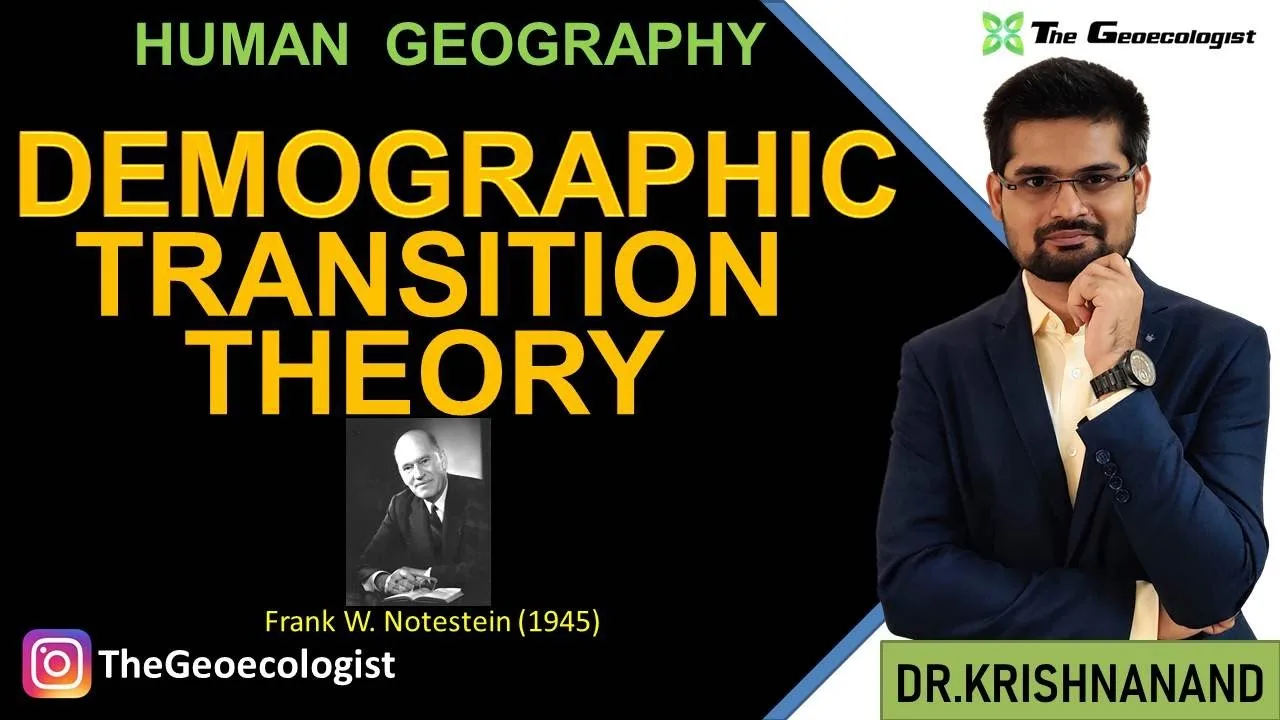
Table of Contents
- Historical Evolution of the Demographic Transition Theory
- The Four Classic Stages of Demographic Transition Theory
- Stage 1: High Stationary (Pre-Industrial Society)
- Stage 2: Early Expanding (Early Industrialization)
- Stage 3: Late Expanding (Mature Industrialization)
- Stage 4: Low Stationary (Post-Industrial Society)
- Stage 5: Declining (Very Low Fertility)
- Key Determinants Driving the Demographic Transition
- Criticisms and Limitations of the Demographic Transition Theory
- Demographic Transition Theory in the Indian Context
- Contemporary Relevance and Policy Implications
- Demographic Dividend
- Aging Populations and Silver Economy
- Climate Change and Demographic Vulnerability
- Migration as Demographic Balancer
- Mastering Demographic Transition Theory for UPSC Geography Optional
- Conclusion
The Demographic Transition Theory remains one of the most fundamental frameworks in population geography, providing a systematic explanation for the transformation of birth and death rates as societies progress from pre-industrial to industrialized economic systems. Originally formulated by Frank Notestein in 1945, this theory has become a cornerstone of human geography curricula worldwide, particularly for UPSC Geography Optional aspirants seeking to master population dynamics.
- Core Concept: The Demographic Transition Theory describes the historical shift from high birth and death rates to low birth and death rates as a country develops economically.
- Originator: Frank Notestein formally articulated the theory in 1945, building on earlier observations by Warren Thompson (1929) and Adolphe Landry (1934).
- Five Stages: The model typically outlines four classic stages, with a fifth stage added by modern demographers to account for below-replacement fertility.
- Key Drivers: Industrialization, urbanization, improved healthcare, education (especially female literacy), and access to contraception drive the transition.
- UPSC Relevance: Demographic Transition Theory is a staple in Paper I (Human Geography) and Paper II (Indian Geography) of the UPSC Geography Optional syllabus.
- Contemporary Application: The theory helps explain demographic dividends, aging crises, and policy challenges across different world regions.
Historical Evolution of the Demographic Transition Theory
The intellectual roots of the Demographic Transition Theory trace back to the early 20th century. Warren Thompson, an American demographer, first observed the “demographic transition” in 1929 while studying population trends in industrialized nations. Adolphe Landry, a French demographer, independently developed similar ideas in his 1934 work “La Révolution Démographique.” However, Demographic Transition Theory was Frank Notestein, then director of the Office of Population Research at Princeton University, who systematized these observations into a coherent theoretical framework in his seminal 1945 paper “Population—The Long View.” Notestein’s formulation provided the clear stage-based structure that dominates textbooks today. The theory gained further prominence through the work of Kingsley Davis, who popularized it in his 1945 article “The World Demographic Transition,” and later through the United Nations’ adoption of the framework for global population projections.
For a comprehensive historical overview, the Wikipedia entry on Demographic Transition provides detailed citations of original works by Thompson, Landry, Notestein, and Davis.
The Four Classic Stages of Demographic Transition Theory
Stage 1: High Stationary (Pre-Industrial Society)
In the first stage of the Demographic Transition Theory, both birth rates and death rates are high, typically ranging between 35-50 per 1,000 population. The high mortality stems from famine, infectious diseases (smallpox, cholera, plague), poor sanitation, and limited medical knowledge. High fertility serves as a rational response to high child mortality—families have many children to ensure some survive to adulthood. Population growth remains near zero or very slow (0.05% annually). This stage characterized all human societies before the Industrial Revolution and persists today only in a few isolated indigenous communities. The World Bank’s population data shows no country currently remains entirely in Stage 1, though some regions within fragile states exhibit Stage 1 characteristics.
Stage 2: Early Expanding (Early Industrialization)
Stage 2 marks the onset of the demographic transition proper. Death rates begin a sharp decline (to 20-30 per 1,000) due to improvements in food supply (agricultural revolution), public health measures (vaccination, sanitation), and basic medical advances. Birth rates, however, remain high (35-45 per 1,000) due to cultural lag, religious norms, lack of contraception, and the economic value of child labor in agrarian economies. This gap between high birth rates and falling death rates creates rapid population growth (2-3% annually), often called the “population explosion.” Many least developed countries in Sub-Saharan Africa (e.g., Niger, Somalia, Chad) currently exhibit Stage 2 characteristics, with total fertility rates exceeding 5.0.
Stage 3: Late Expanding (Mature Industrialization)
In Stage 3, birth rates begin a sustained decline (to 15-25 per 1,000) while death rates continue falling slowly (to 10-15 per 1,000). The fertility decline is driven by urbanization, rising costs of child-rearing, increased female education and labor force participation, access to modern contraception, and shifting cultural norms favoring smaller families. Population growth decelerates but remains positive (1-1.5% annually). Countries like India, Indonesia, Bangladesh, and much of Latin America currently occupy this stage. India’s Total Fertility Rate (TFR) declined to 2.0 in 2021 (NFHS-5), signaling the completion of Stage 3 transition at the national level, though significant inter-state variation persists.
Stage 4: Low Stationary (Post-Industrial Society)
Stage 4 features low birth and death rates (both 8-12 per 1,000), resulting in near-zero population growth. Fertility hovers around replacement level (2.1 children per woman). This stage characterizes most developed nations—Western Europe, North America, Japan, Australia, and New Zealand. Aging populations become a defining demographic feature, with median ages exceeding 40 years and old-age dependency ratios rising sharply. The UN World Population Prospects projects that by 2050, over 60% of the global population will live in countries at or below replacement fertility.
Stage 5: Declining (Very Low Fertility)
Modern demographers have added a fifth stage to the Demographic Transition Theory to account for “lowest-low” fertility (TFR below 1.5). Countries like South Korea (TFR 0.72 in 2023), Japan, Italy, Spain, and parts of Eastern Europe exhibit sustained below-replacement fertility, leading to natural population decline without immigration. This stage presents unique policy challenges: shrinking workforces, pension system insolvency, healthcare strain, and “demographic winter” scenarios. Pro-natalist policies (cash incentives, subsidized childcare, parental leave) have had limited success in reversing these trends.
Key Determinants Driving the Demographic Transition
The Demographic Transition Theory identifies several interconnected drivers that propel societies through the stages:
- Economic Development: Industrialization shifts labor from agriculture (where children are assets) to industry/services (where children are costs). Rising per capita income correlates strongly with fertility decline.
- Mortality Decline: Improved nutrition, public health infrastructure, vaccination programs, and medical technology reduce death rates, particularly infant and child mortality—a prerequisite for fertility decline.
- Female Education and Empowerment: Female literacy is the single strongest predictor of lower fertility. Educated women marry later, have greater autonomy, participate in the labor force, and utilize contraception more effectively.
- Urbanization: Urban living increases the opportunity cost of children, reduces extended family support, and exposes populations to new norms and family planning services.
- Contraceptive Access: Availability and acceptability of modern contraception enable couples to achieve desired family sizes. The “unmet need” for family planning remains high in Stage 2 countries.
- Cultural and Ideational Change: Diffusion of small-family norms through media, education, and social networks accelerates fertility decline beyond what economic factors alone predict.
Criticisms and Limitations of the Demographic Transition Theory
Despite its explanatory power, the Demographic Transition Theory faces significant criticisms:
- Eurocentric Bias: The model is based on European historical experience (1750-1950) and assumes a universal linear path. Many developing countries experienced mortality decline without prior economic development (via imported medical technology), creating a “demographic gap” not predicted by the theory.
- Weak Predictive Power: The theory describes historical patterns but poorly predicts timing, pace, or endpoint of transition. Fertility declines in Bangladesh and Iran occurred much faster than in Europe at similar income levels.
- Ignores Political and Policy Factors: State-led family planning programs (China’s One-Child Policy, India’s sterilization campaigns, Iran’s voluntary program) dramatically accelerated transitions independent of economic development.
- Neglects Migration: The model focuses on natural increase (births minus deaths) but international migration now drives population change in many Stage 4/5 countries (e.g., USA, Germany, Canada).
- Stage 5 Unforeseen: The original theory assumed fertility would stabilize at replacement level. Sustained sub-replacement fertility contradicts this assumption and remains theoretically contested.
- Intra-national Heterogeneity: National averages mask vast subnational variation. India’s TFR ranges from 1.1 (Sikkim) to 3.0 (Bihar)—spanning Stages 3 to 5 within one country.
Demographic Transition Theory in the Indian Context
India presents a textbook case for studying the Demographic Transition Theory due to its scale, diversity, and policy history. India entered Stage 2 around 1921 (the “Year of the Great Divide”), when mortality began declining while fertility remained high. The death rate fell from 47 (1911) to 27 (1971), while the birth rate declined slowly from 49 to 37. Stage 3 commenced in the 1970s-80s with accelerating fertility decline, driven by the National Family Planning Programme (launched 1952, world’s first), rising female literacy, and economic liberalization post-1991.
Key milestones in India’s transition:
- 1952: Launch of National Family Planning Programme (initially clinic-based, later target-oriented)
- 1976-77: Emergency-era forced sterilization campaign (backlash set back programme credibility)
- 1990s: Shift to Reproductive and Child Health (RCH) approach, target-free approach
- 2000: National Population Policy (NPP 2000) — holistic, voluntary, rights-based framework
- 2017: Mission Parivar Vikas — focused on 146 high-fertility districts across 7 states
- 2021 (NFHS-5): National TFR reaches 2.0 (below replacement); 31 states/UTs at or below replacement
However, India’s transition is highly uneven. Southern states (Kerala TFR 1.8, Tamil Nadu 1.8) reached Stage 4 by the 1990s. Northern states (Bihar TFR 3.0, UP 2.4, MP 2.0) remain in Stage 3. This “demographic divide” has profound implications for political representation, fiscal federalism, labor markets, and inter-state migration.
Contemporary Relevance and Policy Implications
The Demographic Transition Theory remains indispensable for understanding 21st-century demographic challenges:
Demographic Dividend
Countries in Stage 3 (like India, Indonesia, Brazil) have a window of opportunity—the “demographic dividend”—where the working-age population (15-64) grows faster than dependents (children + elderly). Realizing this dividend requires massive investment in education, skill development, healthcare, and job creation. India’s dividend window extends roughly 2020-2055; failure to capitalize risks a “demographic disaster” of unemployed youth.
Aging Populations and Silver Economy
Stage 4/5 countries face rapid population aging. By 2050, the global 65+ population will double to 1.6 billion. This strains pension systems (pay-as-you-go models become unsustainable), healthcare (chronic disease burden), and long-term care. The “silver economy”—products/services for older adults—emerges as a major growth sector. Japan’s experience (oldest major economy, median age 48) offers policy lessons: automation, robotics in eldercare, raising retirement age, and immigration reform.
Climate Change and Demographic Vulnerability
Stage 2 countries (high fertility, low resilience) face compounding risks: climate vulnerability, resource scarcity, and youth bulges. The Sahel region exemplifies this nexus—rapid population growth (3% annually) amid desertification and conflict. Demographic transition is thus integral to climate adaptation and sustainable development (SDGs 3, 5, 13).
Migration as Demographic Balancer
With fertility below replacement in 60% of countries, international migration becomes the primary demographic balancer. The UN estimates 281 million international migrants (2020). Labor migration from Stage 2/3 regions (Africa, South Asia) to Stage 4/5 regions (Europe, North America, Gulf) will intensify, reshaping geopolitics, remittance flows, and social cohesion.
Mastering Demographic Transition Theory for UPSC Geography Optional
For UPSC Geography Optional aspirants, the Demographic Transition Theory is a high-yield topic appearing in both Paper I (Human Geography: Population Geography section) and Paper II (Indian Geography: Population and Settlement Geography). Master these dimensions:
- Conceptual Clarity: Define each stage with birth/death rate ranges, growth rates, characteristic countries, and drivers. Draw the classic DTM graph (time on X-axis, rates on Y-axis) with labeled stages.
- Critiques: Memorize 4-5 key criticisms (Eurocentrism, migration neglect, policy role, Stage 5 anomaly, intra-national variation) with examples.
- Indian Application: Know NFHS-5 data (TFR 2.0, state-wise variation), policy timeline (1952, 1976, 2000, 2017), and the demographic divide (North vs South).
- Contemporary Links: Connect to demographic dividend, aging, migration, climate vulnerability, SDGs, and NITI Aayog’s “Strategy for New India @75.”
- Map Work: Identify countries in each stage on world map; Indian states by TFR category on India map.
- Answer Writing: Structure answers with: Definition → Stage-wise explanation → Critique → Indian context → Contemporary relevance → Conclusion. Use diagrams (DTM graph, population pyramids for each stage).
Conclusion
The Demographic Transition Theory, despite its limitations, remains the foundational lens through which demographers, geographers, and policymakers interpret global population dynamics. From Frank Notestein’s 1945 formulation to contemporary Stage 5 extensions, the model captures the profound societal transformation accompanying modernization. For UPSC aspirants, mastering this theory is not merely an academic exercise—Demographic Transition Theory provides the analytical toolkit to understand India’s demographic trajectory, the challenges of demographic dividend realization, the North-South divide, and the policy imperatives for inclusive development. As the world navigates unprecedented demographic divergence—youth bulges in Africa, aging in East Asia and Europe, and migration reshaping nations—the Demographic Transition Theory retains its relevance as both a descriptive framework and a prescriptive guide for sustainable population policy.
Frequently Asked Questions
Frank Notestein formally proposed the Demographic Transition Theory in 1945 in his paper "Population—The Long View," building on earlier work by Warren Thompson (1929) and Adolphe Landry (1934).
The five stages are: Stage 1 – High Stationary (high birth/death rates), Stage 2 – Early Expanding (falling death rate, high birth rate), Stage 3 – Late Expanding (falling birth rate), Stage 4 – Low Stationary (low birth/death rates), Stage 5 – Declining (below-replacement fertility).
India nationally reached Stage 3 (Late Expanding) with TFR of 2.0 (NFHS-5, 2021), but significant variation exists: southern states are in Stage 4 (Low Stationary) while northern states like Bihar and UP remain in Stage 3.