Blog
Delhi air pollution: City of Dreams Choking on Toxic Breaths

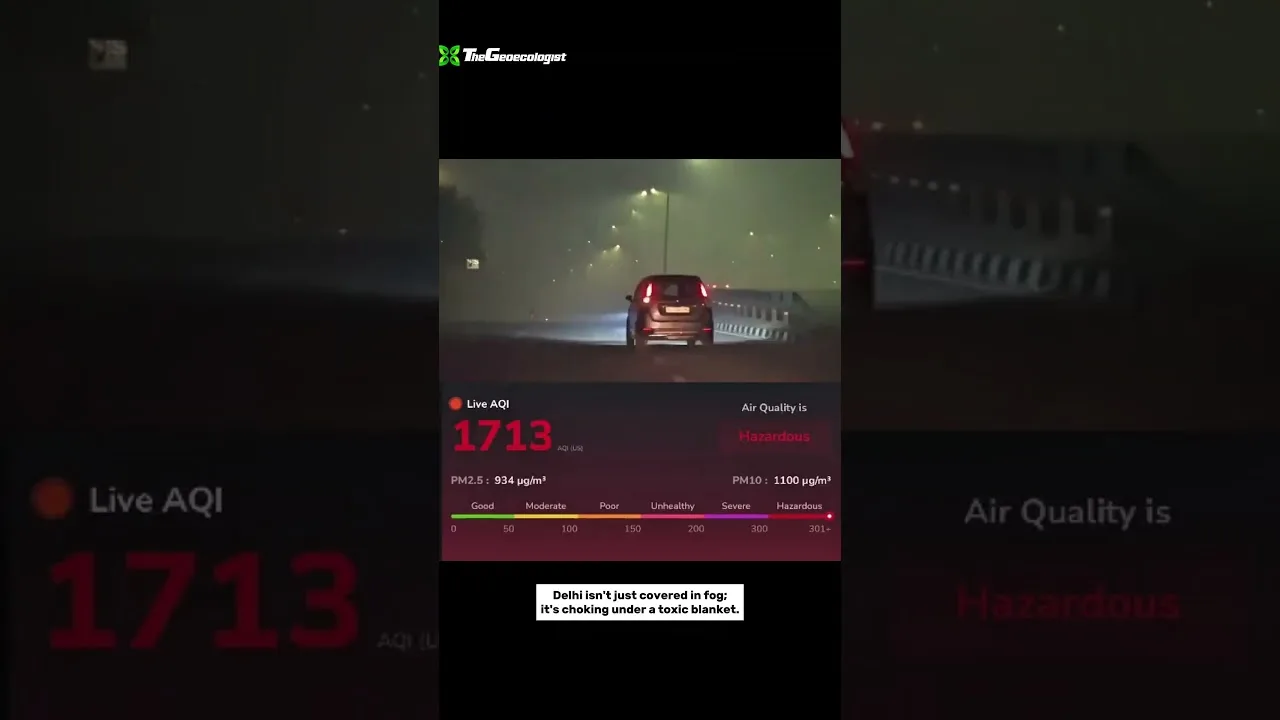
Table of Contents
- Understanding the Severity of Delhi Air Pollution Crisis
- What the Numbers Reveal About Air Quality
- Root Causes: Why Delhi Struggles to Breathe
- Vehicular Emissions: The Persistent Culprit
- Stubble Burning: The Seasonal Spike
- Industrial and Construction Dust
- Meteorological Trapping: Nature's Amplifier
- Human Cost: Behind Every AQI Reading Is a Life
- Respiratory and Cardiovascular Burden
- Children and Vulnerable Populations
- Policy Response: Graded Action and Structural Gaps
- Graded Response Action Plan (GRAP)
- Commission for Air Quality Management (CAQM)
- Technological Fixes: Smog Towers and Beyond
- Pathways to Clean Air: What Must Change
- Energy Transition: Beyond Coal and Diesel
- Public Transport Revolution
- Agricultural Policy Reform
- Regional Airshed Approach
- Monitoring and Data: The Foundation of Action
- Economic Implications: The Cost of Inaction
- Global Lessons: Cities That Turned the Tide
- The Role of Citizens and Civil Society
- Future Outlook: Can Delhi Breathe Again?
- Conclusion: Reclaiming the City of Dreams
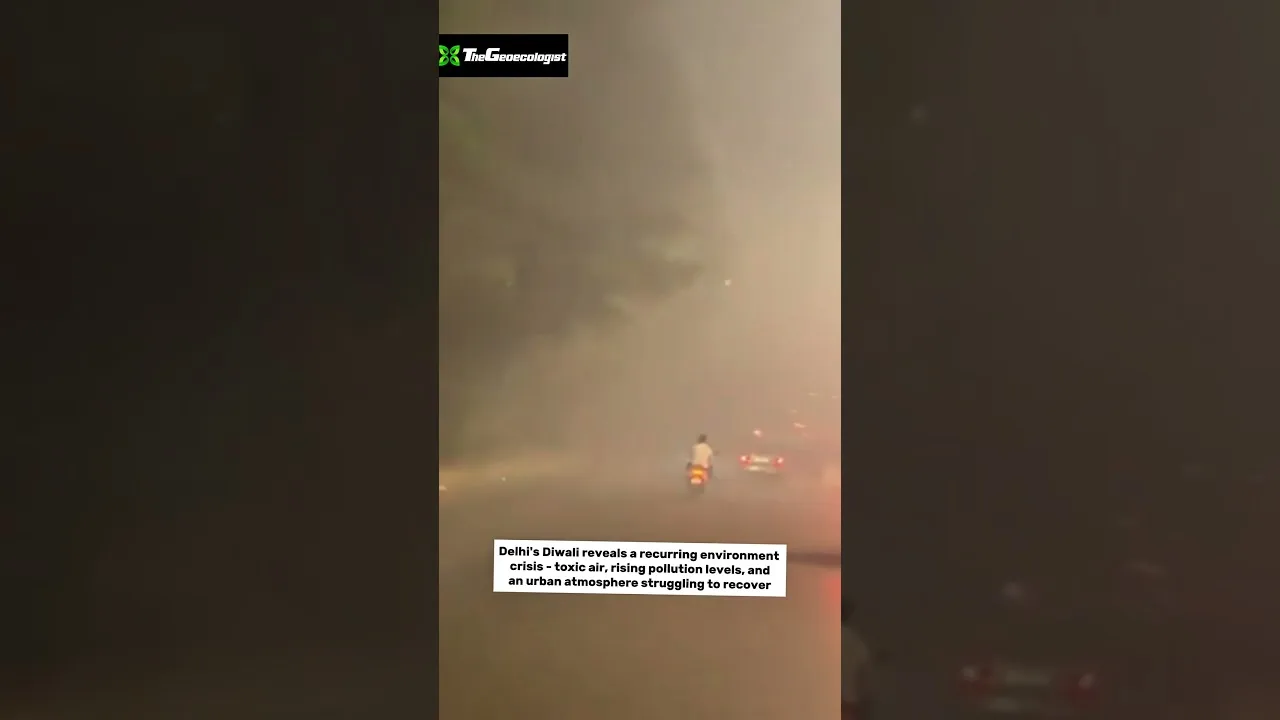
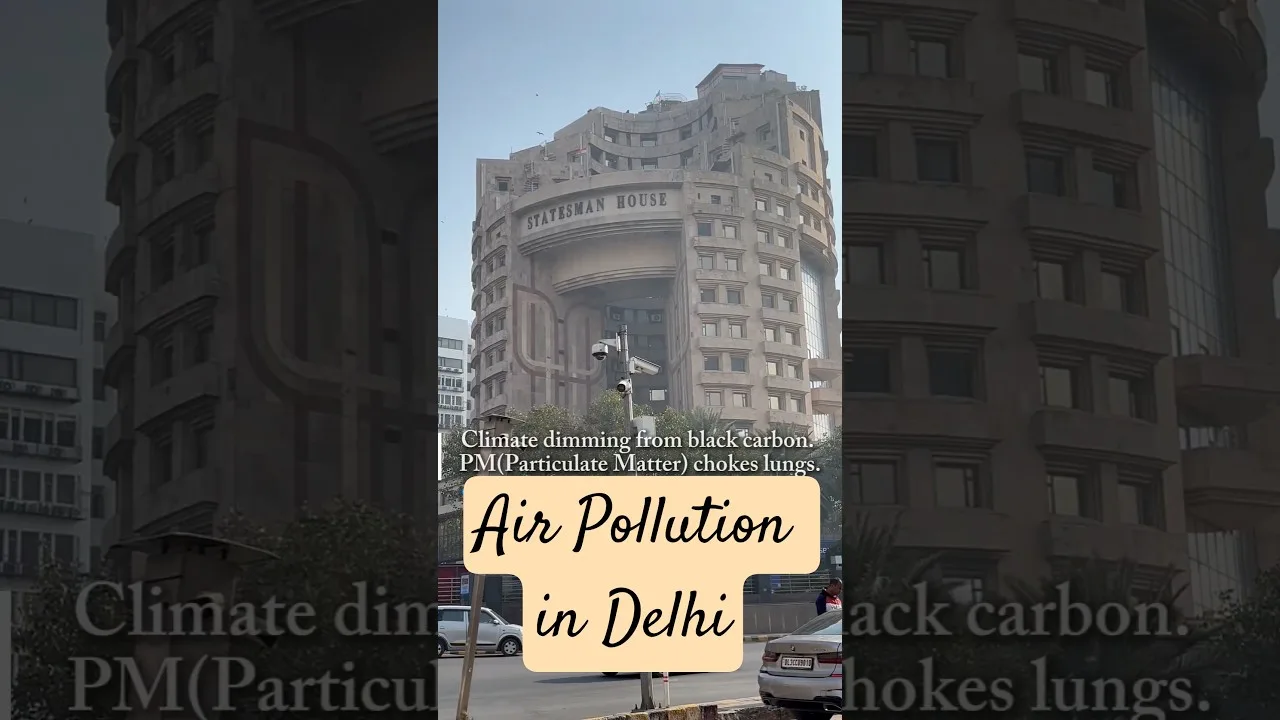
Delhi air pollution has once again pushed the national capital into a severe public health emergency, transforming the city of dreams into a city of toxic breaths. A thick, choking layer of smog blankets the metropolitan region, drastically reducing visibility and raising alarming concerns about environmental quality and human survival. From vehicular emissions and industrial pollution to construction dust, stubble burning, and unfavourable meteorological conditions, multiple factors converge to create this annual environmental crisis that affects over 30 million residents.
- Delhi air pollution reaches hazardous levels annually between October and January, with AQI frequently exceeding 400 (severe category).
- Primary contributors include vehicular emissions (40%), stubble burning (15-30% in peak season), industrial output, construction dust, and meteorological trapping.
- Health impacts are severe: reduced life expectancy by 11.9 years, rising respiratory diseases, cardiovascular complications, and cognitive impairment in children.
- Government interventions like GRAP, odd-even scheme, and smog towers show limited effectiveness without regional coordination.
- Long-term solutions require clean energy transition, public transport overhaul, agricultural policy reform, and strict enforcement across NCR states.
Understanding the Severity of Delhi Air Pollution Crisis
The Delhi air pollution crisis is not merely a seasonal inconvenience but a year-round public health catastrophe. According to the World Health Organization (WHO), Delhi consistently ranks among the world’s most polluted capital cities. The Air Quality Index (AQI) — a standardized measure combining PM2.5, PM10, NO2, SO2, CO, and O3 concentrations — routinely breaches the 400 mark during winter months, categorizing air quality as “severe” to “hazardous.” In November 2023, Anand Vihar recorded an AQI of 486, while RK Puram hit 463, far exceeding the WHO’s safe PM2.5 annual mean guideline of 5 µg/m³.
What the Numbers Reveal About Air Quality
Data from the Central Pollution Control Board (CPCB) and System of Air Quality and Weather Forecasting and Research (SAFAR) paint a grim picture. During the 2023-24 winter season, Delhi experienced 22 “severe” air quality days between November and January alone. The annual average PM2.5 concentration in 2023 stood at 102 µg/m³ — over 20 times the WHO guideline. A 2023 study by the Energy Policy Institute at the University of Chicago (EPIC) estimated that Delhi air pollution reduces life expectancy by 11.9 years for the average resident, the highest loss globally for any major city.
Root Causes: Why Delhi Struggles to Breathe
Vehicular Emissions: The Persistent Culprit
With over 13 million registered vehicles as of 2024 — the highest in India — transportation remains the single largest contributor to Delhi air pollution, accounting for approximately 40% of PM2.5 emissions according to a 2021 TERI-ARAI source apportionment study. Despite the introduction of BS-VI norms in 2020, the sheer volume of traffic, coupled with a high proportion of older diesel vehicles and two-wheelers, continues to overwhelm mitigation efforts. The odd-even scheme, implemented intermittently since 2016, provides only marginal relief (5-13% reduction) during enforcement periods.
Stubble Burning: The Seasonal Spike
Every October and November, agricultural residue burning in Punjab, Haryana, and Uttar Pradesh contributes 15-30% to Delhi’s PM2.5 load, with peak days seeing contributions exceeding 40%. Despite the Commission for Air Quality Management (CAQM) directives and subsidies for happy seeders and super straw management systems, satellite data from NASA’s FIRMS detected over 55,000 farm fire events in Punjab alone during the 2023 season. The economic compulsion for farmers — a narrow 10-15 day window between paddy harvest and wheat sowing — makes behavioral change difficult without viable, profitable alternatives.
Industrial and Construction Dust
Delhi’s 3,000+ industrial units, many operating in non-conforming areas, emit significant quantities of SO2, NOx, and particulate matter. The 2021 switch to PNG (piped natural gas) for industrial fuel was a positive step, but enforcement remains patchy. Construction activities across the NCR generate massive dust (PM10), contributing an estimated 20-25% to coarse particulate load. While the CAQM mandates anti-smog guns, water sprinkling, and green barriers at sites >500 sqm, compliance monitoring is inadequate.
Meteorological Trapping: Nature’s Amplifier
Delhi’s geography and winter meteorology create a perfect pollution trap. Low temperatures, calm winds (<2 m/s), low mixing layer height (<500m), and high humidity promote pollutant accumulation and secondary aerosol formation. Temperature inversions — where a warm layer traps cooler air near the surface — act like a lid, preventing vertical dispersion. Climate change is exacerbating this: a 2022 IIT Delhi study found a 20% increase in stagnation days over the past three decades.
Human Cost: Behind Every AQI Reading Is a Life
Respiratory and Cardiovascular Burden
The health toll of Delhi air pollution is staggering. AIIMS Delhi reported a 30-40% surge in respiratory OPD visits during severe air days in 2023. Chronic obstructive pulmonary disease (COPD), asthma exacerbations, and lung cancer incidence are rising. A 2021 Lancet Planetary Health study attributed 1.67 million deaths in India to air pollution in 2019, with Delhi bearing a disproportionate share. Fine particulates (PM2.5) penetrate deep into alveoli, enter bloodstream, and trigger systemic inflammation, increasing risks of heart attacks, strokes, and hypertension.
Children and Vulnerable Populations
Children are uniquely vulnerable — their developing lungs, higher respiratory rates, and greater outdoor exposure amplify risks. A 2022 study by the Lung Care Foundation found that 1 in 3 children in Delhi schools had impaired lung function. Cognitive development is also affected: research from the Barcelona Institute for Global Health linked prenatal PM2.5 exposure to lower IQ and attention deficits. The elderly, outdoor workers, and those with pre-existing conditions face compounded risks. Clean air is not a privilege; Delhi air pollution is a basic necessity denied to millions.
Policy Response: Graded Action and Structural Gaps
Graded Response Action Plan (GRAP)
Implemented since 2017 and revised in 2022, GRAP triggers staged restrictions based on AQI thresholds: Stage 1 (Poor, 201-300) — mechanized sweeping, waste burning bans; Stage 2 (Very Poor, 301-400) — parking fee hikes, enhanced bus/metro frequency; Stage 3 (Severe, 401-450) — construction bans, BS-III petrol/BS-IV diesel restrictions; Stage 4 (Severe+, >450) — truck entry bans, school closures, work-from-home advisories. While GRAP provides a framework, its reactive nature — acting after pollution peaks — limits preventive impact.
Commission for Air Quality Management (CAQM)
Established in 2021 via ordinance (later Act), CAQM coordinates across Punjab, Haryana, Rajasthan, Uttar Pradesh, and Delhi. It has issued directions on industrial fuel switching, construction dust control, and stubble management. However, its powers remain largely advisory for state-level implementation, and inter-state coordination on stubble burning remains politically fraught.
Technological Fixes: Smog Towers and Beyond
Delhi installed two smog towers (Connaught Place, Anand Vihar) in 2021 at ₹22 crore each, claiming 50% PM2.5 reduction in a 1 km radius. Independent audits by IIT Bombay and IIT Delhi found actual efficacy at 10-15% within 100m — negligible at city scale. Experts argue resources are better invested in emission reduction at source. The Wikipedia entry on Delhi air pollution documents these interventions and their contested effectiveness.
Pathways to Clean Air: What Must Change
Energy Transition: Beyond Coal and Diesel
Delhi’s three coal-fired power plants (Badarpur closed 2018; Rajghat, IP retired) eliminated local generation, but the NCR still hosts 11 coal plants within 300km. Accelerating renewable integration — Delhi’s solar policy targets 6 GW by 2025 — and enforcing flue-gas desulfurization (FGD) at remaining plants are critical. Electrification of transport, supported by 18,000+ charging points targeted by 2026, must outpace vehicle growth.
Public Transport Revolution
Delhi Metro’s 393 km network carries 4.5 million daily, but last-mile connectivity gaps push commuters to private vehicles. Expanding bus fleet to 11,000 (currently ~7,000), dedicated bus lanes, and integrated ticketing can shift modal share. The 2023 Economic Survey noted that a 10% increase in public transport ridership reduces PM2.5 by 2-3%.
Agricultural Policy Reform
Breaking the paddy-wheat cycle requires MSP guarantees for alternative crops (millets, pulses, oilseeds), direct seeding of rice (DSR) to shorten crop duration, and viable ex-situ stubble utilization (biomass power, bio-CNG, packaging). The 2024-25 budget allocated ₹1,500 crore for crop residue management — a start, but sustained farmer income support is essential.
Regional Airshed Approach
Pollution ignores administrative boundaries. The Indo-Gangetic Plain functions as a single airshed — emissions from Punjab affect Delhi, and Delhi’s emissions affect downwind cities. The National Clean Air Programme (NCAP) targets 40% PM reduction by 2026 in 131 non-attainment cities, but airshed-level coordination with shared monitoring, modeling, and accountability frameworks is the only scientifically sound path.
Monitoring and Data: The Foundation of Action
Delhi’s monitoring network — 40 CPCB real-time stations, 100+ low-cost sensors, and satellite remote sensing — provides granular data. The Central Pollution Control Board dashboard and SAFAR forecasts enable graded responses. However, hyperlocal monitoring in informal settlements, industrial clusters, and traffic corridors remains sparse. Citizen science initiatives and low-cost sensor networks can democratize data access and drive community action.
Economic Implications: The Cost of Inaction
The World Bank estimated India’s air pollution welfare losses at 8.5% of GDP (2019). For Delhi, a 2022 Dalberg study quantified annual costs at ₹2.7 lakh crore — healthcare expenditure, productivity losses, reduced tourism, and talent outflow. Businesses report hiring difficulties; expatriate families relocate. Clean air investment yields returns: the US Clean Air Act delivered $30 benefits per $1 invested. Delhi’s economic future depends on treating air quality as infrastructure, not externality.
Global Lessons: Cities That Turned the Tide
Beijing reduced PM2.5 by 55% (2013-2023) through coal bans, vehicle quotas, industrial relocation, and regional coordination — backed by political will and public transparency. London’s Ultra Low Emission Zone (ULEZ) cut NO2 by 44% in central London. Mexico City’s “Hoy No Circula” combined with fuel reformulation and metro expansion. Common threads: multi-year action plans, independent regulation, real-time data transparency, and public participation. Delhi has the technical knowledge; implementation at scale is the gap.
The Role of Citizens and Civil Society
Top-down policy fails without bottom-up demand. Citizen movements — “My Right to Breathe,” “Delhi Clean Air Forum” — have driven judicial interventions (Supreme Court’s 2018 firecracker ban, 2021 stubble directives). School closures trigger parental activism. RWAs monitoring construction dust, reporting waste burning via apps (Green Delhi, Sameer), and demanding ward-level action plans create accountability. Behavioral shifts — carpooling, waste segregation, indoor air purifiers — complement systemic change. The question is not how long Delhi can survive this pollution, but how long we will allow it to continue.
Future Outlook: Can Delhi Breathe Again?
Projections under current policies show Delhi meeting WHO interim targets (35 µg/m³) only by 2040+. Accelerated action — full EV transition by 2035, 100% renewable grid, zero stubble burning, strict industrial enforcement — could achieve 35 µg/m³ by 2030. The 2024 CAQM directive for “micro-action plans” at 13 pollution hotspots (Anand Vihar, Wazirpur, Jahangirpuri, etc.) is a step toward granular accountability. Technology — AI-based source attribution, satellite monitoring, low-cost sensors — improves precision. But political consensus across NCR states, sustained funding, and public pressure remain the ultimate determinants.
Conclusion: Reclaiming the City of Dreams
Delhi air pollution is a solvable crisis — not an inevitable fate. The science is clear, the technologies exist, and the economic case is compelling. What remains is the collective will to prioritize breath over convenience, long-term health over short-term expediency, and coordinated regional action over fragmented jurisdictional blame. Every AQI reading represents a child’s compromised lung, an elder’s strained heart, a worker’s lost wages. Clean air is not a privilege. It is a basic necessity. The city of dreams must not remain a city of toxic breaths. The time for decisive, sustained, airshed-scale action is now — because behind every statistic is a human life exposed to polluted air, waiting for the day the sky turns blue again.
Frequently Asked Questions
The main causes of Delhi air pollution in winter are vehicular emissions (40%), stubble burning from neighboring states (15-30%), industrial pollution, construction dust, and unfavorable meteorological conditions like temperature inversion and low wind speeds that trap pollutants.
According to the Energy Policy Institute at the University of Chicago (EPIC), Delhi air pollution reduces life expectancy by 11.9 years for the average resident, the highest loss globally for any major city, due to sustained exposure to PM2.5 levels far exceeding WHO guidelines.
Key measures include the Graded Response Action Plan (GRAP) with staged restrictions based on AQI, the Commission for Air Quality Management (CAQM) for inter-state coordination, BS-VI vehicle norms, industrial fuel switching to PNG, smog towers, and the National Clean Air Programme (NCAP) targeting 40% PM reduction by 2026.