Blog
Topographical Maps NCERT: Complete Class 11 Guide for CBSE & Competitive Exams

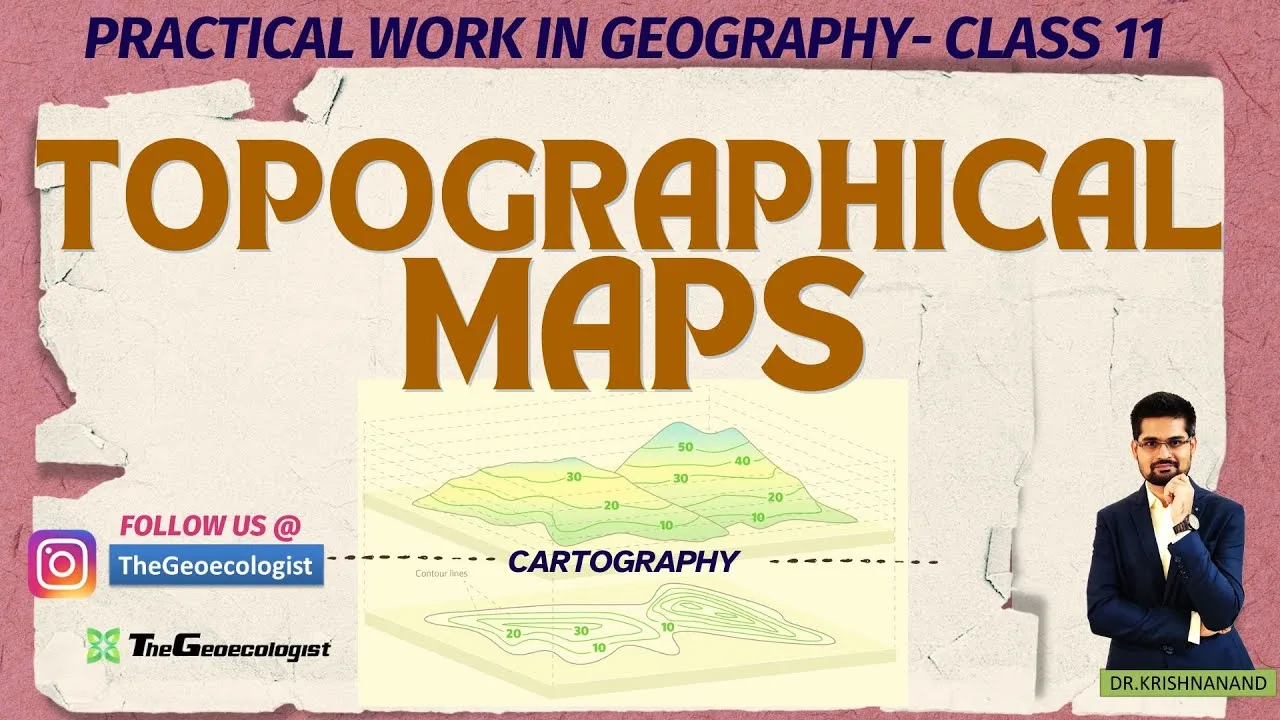
Table of Contents
- What Are Topographical Maps NCERT Chapter 5?
- Key Components of Topographical Maps NCERT Class 11
- Scale and Representative Fraction (RF)
- Contour Lines and Elevation Representation
- Grid Reference System: Eastings and Northings
- Conventional Symbols and Color Codes
- How to Read Topographical Maps: Step-by-Step Guide
- Identifying Landforms Through Contour Patterns
- Interpreting Drainage Patterns and Water Features
- Analyzing Human Settlements and Infrastructure
- Calculating Gradient and Drawing Cross-Sections
- Gradient Formula and Practical Application
- Cross-Section Drawing Technique
- Why Topographical Maps NCERT Chapter 5 Matters for Competitive Exams
- CBSE Class 11 Practical Geography
- CUET and UGC NET Geography
- UPSC Geography Optional
- Expert Exam Tips and Common Pitfalls to Avoid
- Leveraging TheGeoecologist's Bilingual Resources
- Conclusion
Topographical maps NCERT Chapter 5 is a cornerstone of the Class 11 Practical Work in Geography curriculum, equipping students with essential cartographic skills for academic excellence and competitive exam success. These large-scale maps depict natural and human-made features with remarkable precision, using standardized symbols, contour lines, and grid references that form the language of professional geography. Mastering this chapter opens doors to high scores in CBSE board exams, CUET, UGC NET, and UPSC Geography Optional.
- Topographical maps NCERT Chapter 5 covers map scale, contour interpretation, grid references, and conventional symbols.
- Contour line spacing directly indicates slope steepness: close contours = steep terrain; wide spacing = gentle slopes.
- Grid references (eastings/northings) enable precise location identification — a frequently tested skill in exams.
- Gradient calculation (Vertical Interval ÷ Horizontal Equivalent) is crucial for terrain analysis questions.
- TheGeoecologist’s bilingual (Hindi-English) video resources provide visual demonstrations of cross-section drawing and Survey of India conventions.
What Are Topographical Maps NCERT Chapter 5?
Topographical maps NCERT defines as large-scale representations (typically 1:50,000 or 1:25,000) that portray both physical features — mountains, valleys, rivers, plateaus — and cultural features like settlements, roads, railways, and administrative boundaries. Unlike thematic maps that focus on a single variable, topographical sheets provide a holistic view of the landscape. The Survey of India, established in 1767, serves as the national mapping agency responsible for producing these maps following rigorous specifications. According to the Wikipedia entry on topographic maps, these maps are characterized by quantitative representation of relief through contour lines, making them indispensable for planning, navigation, and geographical analysis.
Key Components of Topographical Maps NCERT Class 11
Scale and Representative Fraction (RF)
Scale is the fundamental relationship between map distance and ground distance. Topographical maps NCERT emphasizes three scale expressions: Representative Fraction (e.g., 1:50,000), Verbal Scale (“1 cm represents 500 meters”), and Graphical Scale (bar scale). Converting between these forms is a core examination skill. For instance, at 1:50,000 scale, 1 cm on the map equals 50,000 cm (or 500 m) on the ground. The Survey of India publishes topographical sheets at multiple scales, with 1:50,000 being the standard for detailed terrain analysis.
Contour Lines and Elevation Representation
Contour lines — imaginary lines joining points of equal elevation above mean sea level — are the hallmark of topographical mapping. Topographical maps NCERT teaches that contour interval (vertical distance between successive contours) remains constant on a given sheet, typically 20 meters for 1:50,000 sheets. Key interpretation rules include: V-shaped contours pointing uphill indicate valleys; U-shaped contours pointing downhill show ridges; closed concentric contours represent hills or depressions (distinguished by hachures); and contour spacing correlates directly with gradient. The National Council of Educational Research and Training (NCERT) Practical Geography textbook provides standardized diagrams for each landform type.
Grid Reference System: Eastings and Northings
The National Grid Reference system divides the map into 1 km × 1 km squares using blue grid lines. Eastings (vertical lines) increase eastward; Northings (horizontal lines) increase northward. A four-figure grid reference (e.g., 0423) identifies a 1 km square; a six-figure reference (e.g., 042235) pinpoints a location within 100 m accuracy. Topographical maps NCERT examination questions frequently test this skill, requiring students to locate features or provide grid references for specific symbols.
Conventional Symbols and Color Codes
Survey of India employs a standardized legend where colors convey feature categories: Blue for water bodies (perennial rivers, tanks, wells); Brown for contour lines, form lines, and sand features; Black for cultural features (roads, buildings, railways, boundaries); Green for vegetation (forests, orchards, scrub); Yellow for cultivated land; and Red for major roads and settlements. Topographical maps NCERT Chapter 5 includes a comprehensive symbol chart that students must memorize for rapid feature identification during timed examinations.
How to Read Topographical Maps: Step-by-Step Guide
Identifying Landforms Through Contour Patterns
Landform recognition is the most tested aspect of topographical maps NCERT. Valleys appear as V-shaped contours with the apex pointing toward higher ground; the contour values decrease toward the valley floor. Ridges show U-shaped contours with the apex pointing toward lower ground. Conical hills display concentric circular contours with increasing values toward the center. Plateaus exhibit closely spaced contours at the edges (escarpments) and widely spaced contours on the flat top. Saddle (col) appears as a dip between two hills, with contours forming an hourglass pattern. TheGeoecologist’s video tutorials animate these patterns, helping visual learners internalize the 3D-to-2D translation.
Interpreting Drainage Patterns and Water Features
Drainage patterns reveal underlying geology and structure. Dendritic patterns (tree-like) indicate homogeneous rock; Trellis patterns suggest folded sedimentary strata; Radial patterns emanate from volcanic cones or domes; Centripetal patterns flow into inland basins. Topographical maps NCERT requires identifying perennial vs. seasonal streams (solid vs. dashed blue lines), waterfalls (contours crossing river with hachures), and man-made features like dams, canals, and wells. River direction is determined by contour values decreasing downstream or by the V-shape of contours crossing the river pointing upstream.
Analyzing Human Settlements and Infrastructure
Settlement patterns — nucleated, dispersed, linear — reflect relief, water availability, and transport networks. Topographical maps NCERT teaches identification of metalled roads (double red lines), unmetalled roads (double black lines), cart tracks (single dashed lines), footpaths (single dotted lines), and railways (single line with cross-hatches). Key infrastructure symbols include post offices (PO), police stations (PS), hospitals (H), temples, mosques, churches, and forts. Exam questions often ask: “What is the main occupation of people in grid square 1234?” requiring synthesis of land use, water sources, and transport evidence.
Calculating Gradient and Drawing Cross-Sections
Gradient Formula and Practical Application
Gradient quantifies slope steepness, critical for engineering, agriculture, and route planning. The formula: Gradient = Vertical Interval (VI) ÷ Horizontal Equivalent (HE). VI is the contour interval multiplied by number of contours crossed; HE is the map distance measured between two points multiplied by the scale denominator. For example, crossing 5 contours (20 m interval) over 2 cm map distance at 1:50,000 scale: VI = 100 m, HE = 1000 m, Gradient = 1:10 (1 in 10). Topographical maps NCERT problems often provide two points and ask for gradient calculation or slope classification (gentle: 1:20 to 1:50; moderate: 1:10 to 1:20; steep: >1:10).
Cross-Section Drawing Technique
A cross-section (topographic profile) visualizes terrain along a transect line. Steps: (1) Draw a straight line between two points on the map. (2) Mark contour intersections on a strip of paper. (3) Transfer marks to graph paper with suitable vertical exaggeration (typically 5× to 10× horizontal scale). (4) Plot elevation points and connect with a smooth curve. (5) Label key features (hill, valley, road, river). Topographical maps NCERT practical exams award significant marks for accurate cross-sections with proper vertical exaggeration notation. TheGeoecologist demonstrates this process with real Survey of India sheet examples.
Why Topographical Maps NCERT Chapter 5 Matters for Competitive Exams
CBSE Class 11 Practical Geography
The CBSE Class 11 Practical Geography syllabus allocates 30 marks to practical work, with topographical maps constituting a major portion. Board exam questions test: symbol identification (5-6 marks), contour interpretation (4-5 marks), grid reference (3-4 marks), scale conversion (2-3 marks), and cross-section drawing (5-6 marks). Topographical maps NCERT Chapter 5 is the prescribed textbook, making thorough coverage non-negotiable. Previous year papers show recurring themes: identifying landforms in given grid squares, calculating gradient between two points, and describing drainage patterns.
CUET and UGC NET Geography
The Common University Entrance Test (CUET) Geography section includes 5-8 map-based MCQs annually. UGC NET Geography Paper II features 10-15 questions on cartography and map interpretation. Both exams test advanced applications: composite contour patterns, slope analysis using Wentworth’s method, relative relief calculation, and drainage density computation. Topographical maps NCERT fundamentals form the baseline; aspirants must practice with multiple Survey of India sheets (e.g., 45D/10, 55A/3) to build speed and accuracy.
UPSC Geography Optional
UPSC Geography Optional Paper II (Indian Geography) and Paper I (Physical Geography) frequently incorporate topographical map analysis. Questions may ask: “Interpret the relationship between relief, drainage, and settlement in the given topographical sheet” or “Explain the significance of contour intervals in representing Himalayan vs. Peninsular terrain.” The 2023 UPSC Mains included a 15-mark question on contour interpretation. Topographical maps NCERT mastery, combined with TheGeoecologist’s advanced problem-solving sessions, gives aspirants a decisive edge in this high-stakes examination.
Expert Exam Tips and Common Pitfalls to Avoid
Topographical maps NCERT examiners report consistent errors: (1) Confusing eastings and northings — always read eastings first (“along the corridor, up the stairs”). (2) Misreading contour values — verify index contours (thick lines) every 100 m. (3) Forgetting vertical exaggeration in cross-sections — always state the VE ratio. (4) Mixing up seasonal/perennial stream symbols — dashed vs. solid blue lines. (5) Incorrect gradient units — express as ratio (1:25), not degrees. Pro tip: Practice with a magnifying glass for dense symbol clusters. Memorize the Survey of India legend using mnemonic devices: “Blue for Water, Brown for Ground, Black for Culture, Green for Scene, Yellow for Fellow (cultivation), Red for Road Ahead.” TheGeoecologist’s video employs visual mnemonics for each symbol category.
Leveraging TheGeoecologist’s Bilingual Resources
TheGeoecologist’s YouTube channel and website (thegeoecologist.com) offer structured Hindi-English blended instruction for topographical maps NCERT Chapter 5. The video series breaks down each sub-topic — scale conversion, contour diagrams, grid reference practice, cross-section drawing — with real Survey of India sheet walkthroughs. Paid courses for UPSC, CUET, and UGC NET/JRF provide: annotated map sheets, previous year question banks, mock tests with video solutions, and live doubt-clearing sessions. The bilingual approach ensures conceptual clarity for students from diverse linguistic backgrounds, a unique advantage in India’s multilingual academic landscape.
Conclusion
Mastering topographical maps NCERT Chapter 5 transforms abstract cartographic concepts into practical analytical tools. From decoding contour patterns to calculating precise gradients, these skills form the bedrock of geographical thinking. Whether targeting 95+ in CBSE Class 11 practicals, cracking CUET for top universities, qualifying UGC NET for academia, or acing UPSC Geography Optional, systematic practice with authentic Survey of India sheets is indispensable. Integrate NCERT fundamentals with TheGeoecologist’s expert demonstrations, maintain a symbol revision notebook, and solve at least 20 full topographical sheets before your exam. The language of maps, once learned, becomes a lifelong lens for understanding our planet’s intricate surface.
Follow for Updates:
- Instagram: @thegeoecologist
- Email: krishna.geography@gmail.com
Enhance your geographical skills today — decode the language of maps and ace your exams! 🌍🗺️
Frequently Asked Questions
The standard contour interval in 1:50,000 scale topographical maps by Survey of India is 20 meters. Index contours (thicker lines) appear every 100 meters (every 5th contour) for easier elevation reading.
Gradient = Vertical Interval (VI) ÷ Horizontal Equivalent (HE). VI = number of contours crossed × contour interval. HE = map distance (cm) × scale denominator (e.g., 50,000) converted to meters. Express as ratio (1:25).
Frequently tested sheets include 45D/10 (Rajasthan desert), 55A/3 (Deccan plateau), 56G/12 (Western Ghats), and 78A/16 (Himalayan terrain). Practice diverse physiographic regions for comprehensive preparation.