Blog
Limits to Growth: Economic Geography Concepts for UPSC

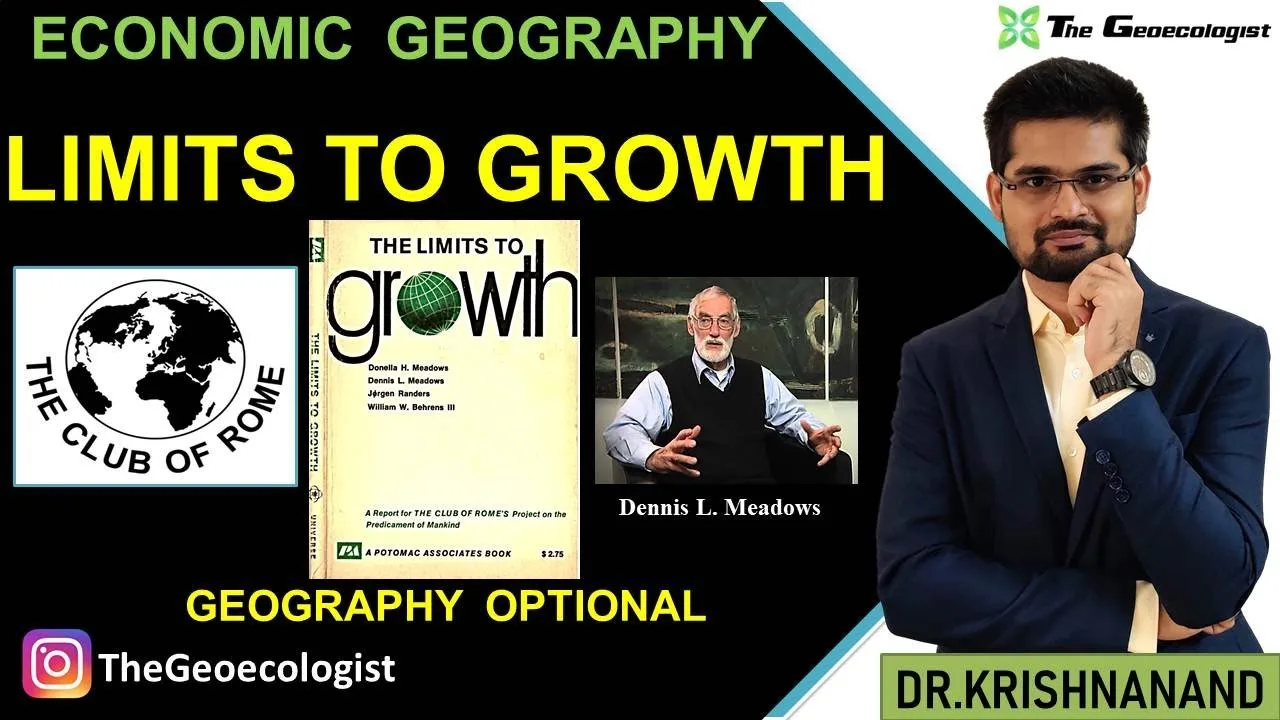
Table of Contents
- Historical Context: The Club of Rome and the 1972 Report
- The World3 Model: Methodology and Key Variables
- 1. Population
- 2. Food Production
- 3. Industrial Output
- 4. Pollution
- 5. Non-Renewable Resources
- Major Scenarios and Their Implications
- Scenario 1: Standard Run (Business as Usual)
- Scenario 2: Technology Optimism
- Scenario 3: Stabilized World
- Criticisms and the Evolution of the Debate
- Empirical Validation: How Well Has It Aged?
- Relevance to UPSC Economic Geography
- 1. Resource Geography
- 2. Agricultural Geography
- 3. Industrial Geography
- 4. Population and Settlement Geography
- 5. Sustainable Development and Environmental Geography
- Contemporary Resonance: Climate Change and the Great Acceleration
- Policy Lessons for India
- Key Concepts for UPSC Answer Writing
- Common Pitfalls to Avoid
- Recommended Resources for Deep Study
- Conclusion
The Limits to Growth remains one of the most influential and debated frameworks in economic geography, offering a systems-thinking approach to understanding the interplay between exponential human expansion and finite planetary boundaries. First published in 1972 by the Club of Rome, this seminal report used computer modeling to simulate the consequences of unchecked industrial and population growth on a finite Earth. For UPSC Geography Optional aspirants, mastering this concept is essential not only for Paper II (Economic Geography) but also for General Studies Paper III (Environment, Disaster Management, and Sustainable Development). This article provides a comprehensive, exam-oriented analysis of the Limits to Growth thesis, its methodology, criticisms, updates, and enduring relevance in the Anthropocene.
- The Limits to Growth (1972) was commissioned by the Club of Rome and authored by Dennis Meadows, Donella Meadows, Jørgen Randers, and William Behrens III.
- It used the World3 system dynamics model to simulate five key variables: population, food production, industrialization, pollution, and non-renewable resource depletion.
- The “standard run” scenario predicted overshoot and collapse of global systems by mid-21st century if growth trends continued unchanged.
- Critics initially dismissed it as Malthusian alarmism, but subsequent updates (1992, 2004) and independent validation studies (e.g., Gaya Herrington 2020) show alarming alignment with the “business-as-usual” trajectory.
- For UPSC, the concept bridges economic geography, resource geography, sustainable development, and human ecology — making it a high-yield topic for both Optional and GS papers.
Historical Context: The Club of Rome and the 1972 Report
The Limits to Growth emerged from a growing unease in the late 1960s among scientists, economists, and policymakers about the environmental consequences of post-war industrial acceleration. The Club of Rome, founded in 1968 by Italian industrialist Aurelio Peccei and Scottish scientist Alexander King, convened a multidisciplinary team at the Massachusetts Institute of Technology (MIT) under the leadership of Jay Forrester, the father of system dynamics. The resulting report, published in 1972 by Universe Books, was translated into over 30 languages and sold more than 12 million copies, making it the best-selling environmental book of all time.
The report’s central thesis was deceptively simple: exponential growth in a finite system is impossible. Unlike earlier Malthusian warnings that focused solely on population versus food, the Limits to Growth integrated five interconnected subsystems — population, agricultural production, industrial output, pollution generation, and non-renewable resource consumption — into a single feedback-rich model. This holistic approach distinguished it from linear extrapolations and captured the nonlinear dynamics of overshoot, delay, and collapse.
The World3 Model: Methodology and Key Variables
At the heart of the Limits to Growth lay the World3 model, a system dynamics simulation developed by Jay Forrester and refined by the MIT team. Unlike econometric models that rely on historical correlations, World3 used causal loop diagrams and stock-and-flow structures to represent the physical and feedback mechanisms governing the global socio-ecological system. The model tracked five primary state variables:
1. Population
Global population, driven by birth and death rates, was influenced by food per capita, health services, and education. The model captured the demographic transition but also the lag between rising living standards and falling fertility.
2. Food Production
Agricultural output depended on land yield, land area, and inputs like fertilizer and energy. The model included diminishing returns on intensive farming and the degradation of soil from overuse and pollution.
3. Industrial Output
Industrial capital generated goods and services but required energy, resources, and maintenance. A fraction of output was reinvested, creating a reinforcing loop — but also consuming non-renewable resources and generating pollution.
4. Pollution
Pollution accumulated from industrial and agricultural activities. The model assumed a persistent fraction that degraded ecosystem services, reduced agricultural yields, and increased mortality — a critical feedback often ignored in conventional economics.
5. Non-Renewable Resources
A finite stock of resources (fossil fuels, minerals) was depleted by industrial extraction. As high-grade ores were exhausted, energy and capital costs per unit rose, diverting investment from other sectors — a phenomenon now recognized as declining Energy Return on Energy Invested (EROEI).
The model ran 12 scenarios from 1900 to 2100. The “standard run” (business-as-usual) showed global industrial output peaking around 2020–2030, followed by a sharp decline as resource constraints and pollution feedbacks bit. Food per capita fell, death rates rose, and population collapsed after 2050. Only scenarios with deliberate policy shifts — zero population growth, zero industrial growth, and technological optimization — avoided collapse.
Major Scenarios and Their Implications
The Limits to Growth presented not predictions but conditional projections — “if-then” statements about plausible futures. The key scenarios included:
Scenario 1: Standard Run (Business as Usual)
No major policy or technology changes. Result: Overshoot and collapse by 2050–2070. This remains the benchmark against which reality is tracked.
Scenario 2: Technology Optimism
Assumed unlimited resource substitution, 75% pollution reduction, and doubled agricultural yields. Result: Collapse delayed but not avoided — pollution and resource costs eventually overwhelmed gains.
Scenario 3: Stabilized World
Implemented birth control, resource recycling, pollution control, and shifted industrial output from consumption to services/education. Result: Sustainable equilibrium with high quality of life. This required unprecedented global cooperation and value shifts.
For UPSC aspirants, the critical insight is that Limits to Growth did not predict inevitable doom — it mapped the consequences of inaction. The stabilized world scenario remains a blueprint for sustainable development, echoing the Brundtland Commission (1987) and the 2015 UN Sustainable Development Goals (SDGs).
Criticisms and the Evolution of the Debate
Upon release, the Limits to Growth faced fierce criticism from economists like Robert Solow, William Nordhaus, and Julian Simon. Key objections included:
- Underestimation of technological innovation: Critics argued the model treated technology as exogenous and linear, ignoring market-induced innovation (e.g., Green Revolution, fracking, renewables).
- Resource substitution: The assumption of fixed resource stocks ignored substitution (e.g., fiber optics for copper, renewables for fossil fuels).
- Price mechanism omission: Standard economics holds that scarcity raises prices, spurring efficiency and alternatives — a feedback absent in early World3 versions.
- Data quality: Early resource reserve estimates were crude; subsequent discoveries expanded known reserves.
The authors responded in two major updates: Beyond the Limits (1992) and Limits to Growth: The 30-Year Update (2004). These refined the model with better data, added climate change as a pollution feedback, and incorporated endogenous technological change. Crucially, they showed that even with optimistic assumptions, delayed action made collapse harder to avoid — a phenomenon they termed “policy resistance.”
Empirical Validation: How Well Has It Aged?
In the 21st century, independent researchers have tested the Limits to Growth scenarios against real-world data. The most rigorous study, by Gaya Herrington (2020) at KPMG and published in the Journal of Industrial Ecology, compared 1972 projections with 40 years of UN, World Bank, and IEA data. Her findings:
- The “standard run” and “comprehensive technology” scenarios align closely with observed trajectories (2020 data).
- Industrial output per capita, food per capita, and population trends track the overshoot pathway.
- The “stabilized world” scenario diverges sharply — humanity has not implemented the required structural changes.
A 2021 study by Wikipedia notes that the report’s core insight — that physical limits constrain exponential growth — has been validated by the emergence of planetary boundaries science (Rockström et al., 2009). Six of nine planetary boundaries (climate change, biosphere integrity, land-system change, biogeochemical flows, novel entities, freshwater change) are now transgressed, lending empirical weight to the Limits to Growth framework.
Relevance to UPSC Economic Geography
For UPSC Geography Optional, the Limits to Growth is a cornerstone topic in the “Models and Theories” and “Resources” sections of Paper II. It connects directly to:
1. Resource Geography
The classification of resources (renewable vs. non-renewable, biotic vs. abiotic), the concept of carrying capacity, and the geography of resource depletion (peak oil, peak phosphorus, rare earth elements) are all illuminated by the Limits to Growth lens. Questions on “resource crisis” or “sustainable resource management” demand this theoretical grounding.
2. Agricultural Geography
The model’s treatment of land yield, fertilizer dependence, and pollution-induced yield decline maps onto real issues: soil degradation (33% of global soils degraded per FAO), nitrogen-phosphorus cycle disruption, and the limits of Green Revolution intensification.
3. Industrial Geography
The shifting geography of production, the ecological footprint of global value chains, and the resource intensity of industrialization in the Global South (e.g., China’s post-2000 surge) reflect the industrial capital-resource-pollution feedbacks central to World3.
4. Population and Settlement Geography
The demographic transition, urbanization pressures, and the concept of “demographic dividend” versus “demographic trap” are enriched by the model’s systemic view — population is not an isolated variable but coupled with food, health, and industrial systems.
5. Sustainable Development and Environmental Geography
The Limits to Growth prefigured the Brundtland definition (1987), the Rio Earth Summit (1992), and the SDGs (2015). UPSC GS Paper III questions on climate change, circular economy, and green growth implicitly test this intellectual lineage.
Contemporary Resonance: Climate Change and the Great Acceleration
The Limits to Growth did not explicitly model climate change in 1972 — CO₂ was treated as a generic pollutant. Today, climate change is the paramount manifestation of the growth-limits dilemma. The “Great Acceleration” graphs (Steffen et al., 2015) show socio-economic trends (GDP, energy use, fertilizer consumption) and Earth-system trends (CO₂, temperature, ocean acidification) rising in lockstep since 1950 — exactly the exponential curves the report warned about.
The IPCC Sixth Assessment Report (2021–2023) confirms that limiting warming to 1.5°C requires “rapid, deep, and immediate” emissions cuts — essentially a managed degrowth of fossil industrial capital, echoing the stabilized world scenario. The concept of “stranded assets” (fossil reserves that cannot be burned) directly reflects the Limits to Growth insight that not all physical resources are economically or ecologically extractable.
Policy Lessons for India
India, with 1.4 billion people, rising per capita consumption, and high climate vulnerability, sits at the epicenter of the Limits to Growth challenge. Key policy implications include:
- Energy transition: Moving from coal (70% of electricity) to renewables while ensuring energy access — a classic World3 capital-allocation dilemma.
- Water-food-energy nexus: Groundwater depletion in Punjab, Haryana, and Rajasthan mirrors the model’s resource-depletion feedback.
- Circular economy: The 2022 Vehicle Scrappage Policy, Plastic Waste Management Rules, and Extended Producer Responsibility (EPR) frameworks operationalize the “recycling” lever from the stabilized scenario.
- Demographic management: With TFR now below replacement (2.0), India has achieved the population-stabilization prerequisite — but the “demographic dividend” requires industrial job creation without replicating the high-pollution pathway.
Key Concepts for UPSC Answer Writing
When answering Limits to Growth questions, incorporate these high-value terms and frameworks:
- System dynamics / feedback loops (reinforcing vs. balancing)
- Overshoot and collapse vs. sustainable equilibrium
- Carrying capacity (ecological vs. economic definitions)
- Planetary boundaries (Rockström et al.) as operationalization
- Ecological footprint and biocapacity (Global Footprint Network)
- Degrowth / post-growth / green growth debates
- Intergenerational equity (Brundtland, UNFCCC)
- Energy Return on Energy Invested (EROEI) as a biophysical constraint
Common Pitfalls to Avoid
Many aspirants conflate the Limits to Growth with Malthusianism. Key distinctions:
- Malthus: Linear food growth vs. geometric population → inevitable famine.
- Limits to Growth: Multi-variable, feedback-rich, conditional scenarios → collapse is a choice (inaction), not destiny.
- The report explicitly rejected “prediction” language; it offered scenario planning — a methodology now central to IPCC and corporate strategy.
Recommended Resources for Deep Study
For authoritative primary sources, consult:
- The original 1972 report (available via Club of Rome archives)
- Limits to Growth: The 30-Year Update (2004) by Meadows, Randers, Meadows
- Herrington, G. (2020). “Update to Limits to Growth: Comparing the World3 Model with Empirical Data.” Journal of Industrial Ecology.
- Rockström, J. et al. (2009). “A Safe Operating Space for Humanity.” Nature.
- NCERT Class 12: India: People and Economy (Ch. 5, 9) and Fundamentals of Human Geography (Ch. 3, 8)
Conclusion
The Limits to Growth is not a relic of 1970s environmentalism — it is a living analytical framework that anticipated the polycrisis of the 21st century: climate breakdown, biodiversity loss, resource scarcity, and inequality. For UPSC aspirants, it offers a rare synthesis of geography, economics, systems science, and ethics. Mastering it equips you to answer not just direct questions on models, but to infuse any economic geography answer — on industrial corridors, agricultural sustainability, urban metabolism, or regional planning — with the depth of a systems thinker. As the UN Secretary-General António Guterres warned in 2023, “Humanity has opened the gates of hell” on climate — the Limits to Growth remains our clearest map of how we got here, and where the exit routes lie.
Frequently Asked Questions
The Limits to Growth is a 1972 report commissioned by the Club of Rome and authored by Dennis Meadows, Donella Meadows, Jørgen Randers, and William Behrens III. It used the World3 system dynamics model to simulate the consequences of exponential economic and population growth on a finite planet.
Limits to Growth is a core topic in UPSC Geography Optional Paper II (Economic Geography, Models & Theories, Resources). It connects to resource geography, agricultural geography, industrial geography, population geography, and sustainable development — making it high-yield for both Optional and GS Paper III.
Independent validation studies, notably Gaya Herrington (2020), found that 40 years of real-world data closely track the 'standard run' (business-as-usual) scenario of the 1972 report. Key planetary boundaries have been transgressed, confirming the report's core thesis that unchecked growth leads to overshoot.