Blog
Sea Level Rise: Understanding Causes, Impacts, and Future Projections


Table of Contents
- What Is Sea Level Rise and Why Does It Matter?
- Key Components of Global Mean Sea Level Change
- Historical Observations and Accelerating Trends
- Paleo-Sea Level Context
- Regional Variability: Why Sea Level Rise Is Not Uniform
- Future Projections: Scenarios and Uncertainties
- Long-Term Commitment Beyond 2100
- Impacts on Coastal Systems and Communities
- Coastal Flooding and Erosion
- Saltwater Intrusion and Groundwater Salinization
- Ecosystem Loss and Transformation
- Socioeconomic Disparities and Climate Justice
- Adaptation Strategies: Protect, Accommodate, Advance, Retreat
- Hard Engineering (Protection)
- Nature-Based Solutions (NbS)
- Accommodation and Advance
- Managed Retreat and Relocation
- Monitoring and Early Warning Systems
- Economic Costs and Finance
- Governance and Policy Frameworks
- Sea Level Rise in the Indian Context
- Key Research Frontiers
- Conclusion: Acting Now for a Resilient Future
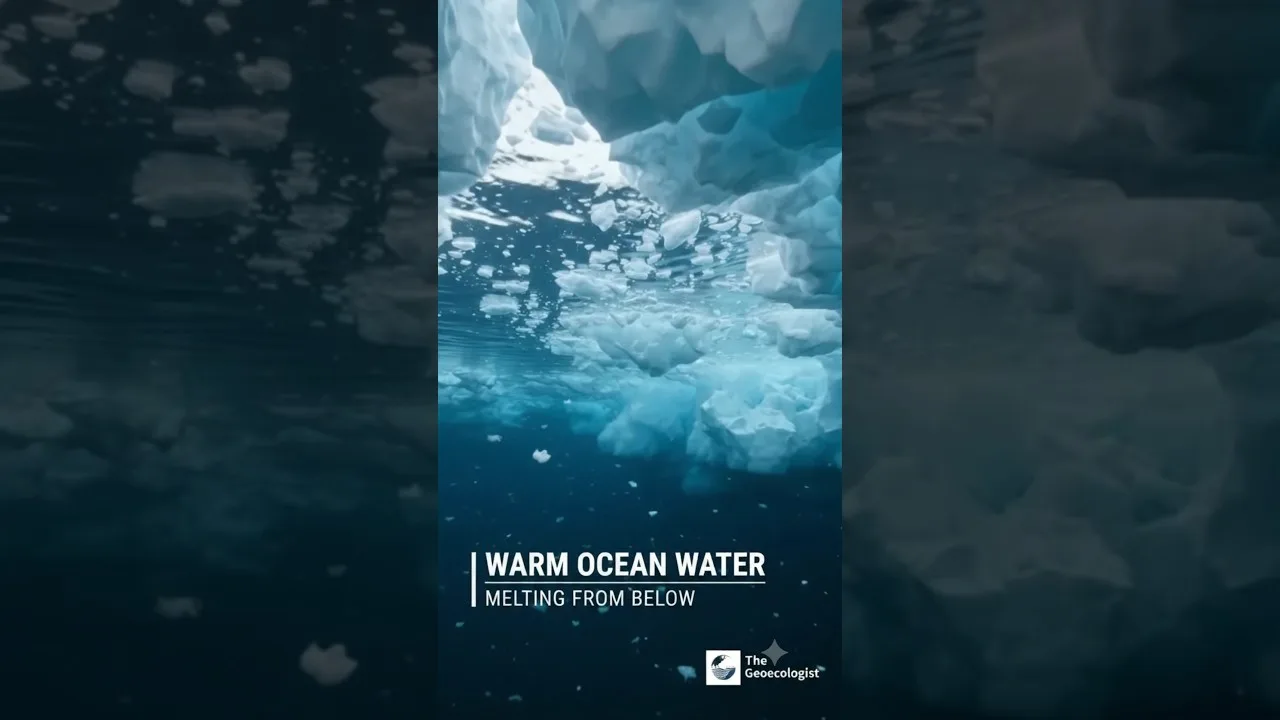
Sea level rise is one of the most visible and consequential indicators of our changing climate, threatening coastal communities, ecosystems, and infrastructure worldwide. As global temperatures increase due to anthropogenic greenhouse gas emissions, the oceans absorb over 90% of excess heat, causing thermal expansion and accelerating the melting of glaciers and ice sheets. This comprehensive guide explores the mechanisms, measurements, regional variations, and adaptation strategies associated with rising seas, drawing on the latest scientific consensus from the Intergovernmental Panel on Climate Change (IPCC) and leading research institutions.
- Sea level rise is driven primarily by thermal expansion and land ice melt, with rates accelerating from 1.4 mm/yr (1901–1990) to 3.7 mm/yr (2006–2018).
- Global mean sea level has risen approximately 20 cm since 1900, with nearly half occurring since 1993.
- Regional variations exist due to ocean dynamics, gravitational effects, and vertical land motion.
- Projections for 2100 range from 0.3–1.0 m under different emission scenarios, with potential for higher values if ice-sheet instability accelerates.
- Adaptation requires integrated coastal zone management, nature-based solutions, and equitable relocation planning.
What Is Sea Level Rise and Why Does It Matter?
Sea level rise refers to the increase in the average height of the ocean’s surface relative to land. It is a direct consequence of global warming and poses existential risks to low-lying islands, deltaic regions, and major coastal cities. According to the IPCC Sixth Assessment Report, human influence is the main driver of observed sea level rise since at least 1971. The phenomenon affects over 680 million people living in low-elevation coastal zones, a number projected to exceed one billion by 2050.
Key Components of Global Mean Sea Level Change
Global mean sea level (GMSL) change integrates two primary components:
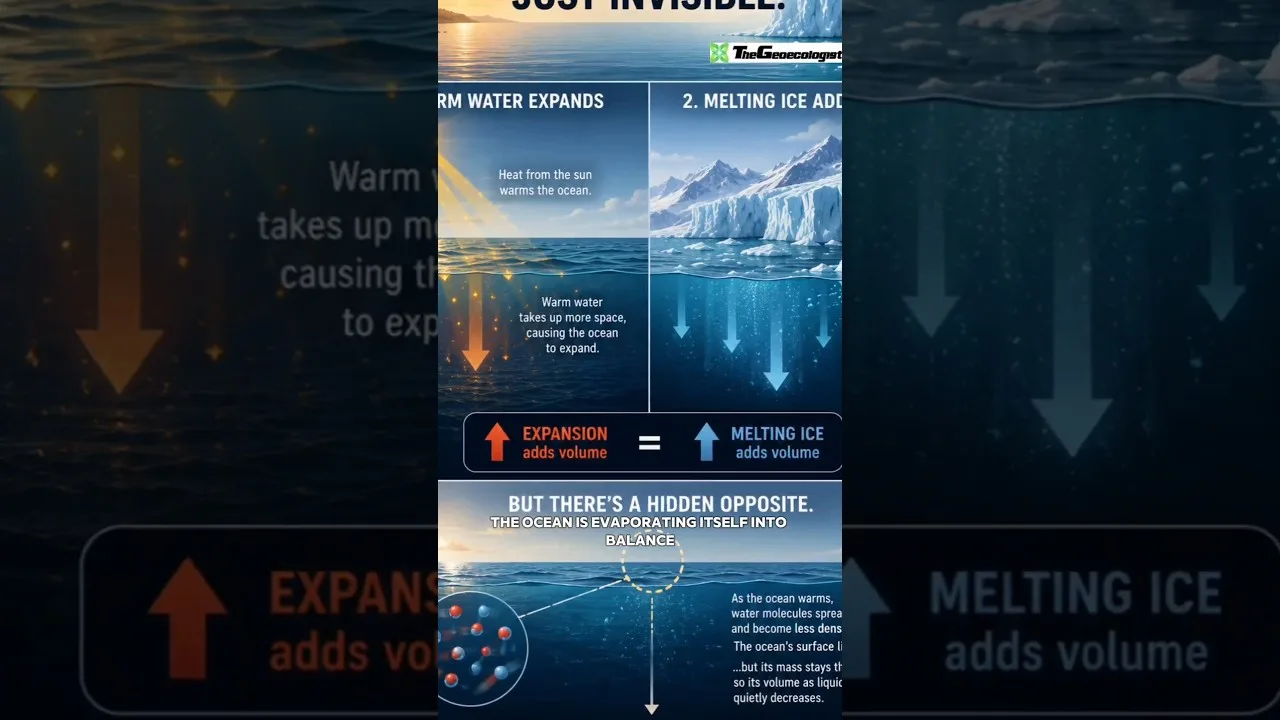
- Thermal expansion (steric effect): As seawater warms, it expands. This contributed ~42% of observed sea level rise during 2006–2018.
- Mass addition from land ice: Melting glaciers, the Greenland Ice Sheet, and the Antarctic Ice Sheet add water to the oceans. Glaciers contributed ~21%, Greenland ~15%, and Antarctica ~8% during the same period.
Additional minor contributions come from changes in terrestrial water storage (groundwater depletion, reservoir impoundment) and atmospheric water vapor.
Historical Observations and Accelerating Trends
Instrumental records of sea level rise begin with tide gauges in the 18th century, but systematic global coverage only emerged with satellite altimetry in 1993. The tide-gauge record, corrected for glacial isostatic adjustment and vertical land motion, shows a 20th-century rate of approximately 1.4 mm/yr. Satellite data from TOPEX/Poseidon, Jason-1/2/3, and Sentinel-6 reveal a clear acceleration to 3.7 mm/yr over 2006–2018.
Paleo-Sea Level Context
Geological evidence from coral reefs, sediment cores, and isotopic records indicates that during the Last Interglacial (~125,000 years ago), when global temperatures were 0.5–1.0°C warmer than pre-industrial, sea levels were 6–9 meters higher. The Mid-Pliocene Warm Period (~3 million years ago), with CO₂ levels similar to today (~400 ppm), saw seas 10–20 meters higher. These analogs underscore the long-term commitment to multi-meter sea level rise even if warming stabilizes.
Regional Variability: Why Sea Level Rise Is Not Uniform
While global mean sea level provides a planetary metric, local relative sea level rise (RSLR) varies dramatically due to:
- Ocean dynamics: Changes in currents, wind patterns, and density redistribution cause regional deviations of ±30% from the global mean.
- Gravitational and rotational effects: Melting ice sheets reduce their gravitational pull, causing water to migrate away from the source. This creates a “fingerprint” where sea level falls near melting ice but rises faster in the far field (e.g., equatorial regions).
- Vertical land motion (VLM): Subsidence from groundwater extraction, sediment compaction, and tectonics can amplify RSLR (e.g., Jakarta, New Orleans), while glacial isostatic adjustment causes uplift in formerly glaciated regions (e.g., Scandinavia, Hudson Bay).
For example, the U.S. East Coast experiences rates 2–3 times the global average due to Gulf Stream weakening and land subsidence, while parts of Alaska see falling relative sea level due to tectonic uplift.
Future Projections: Scenarios and Uncertainties

The IPCC AR6 provides sea level rise projections for five Shared Socioeconomic Pathways (SSPs). By 2100, relative to 1995–2014:
- SSP1-1.9 (very low emissions): 0.28–0.55 m
- SSP1-2.6 (low emissions): 0.32–0.62 m
- SSP2-4.5 (intermediate): 0.44–0.76 m
- SSP3-7.0 (high emissions): 0.63–1.01 m
- SSP5-8.5 (very high emissions): 0.63–1.01 m
These likely ranges (17th–83rd percentile) exclude low-probability, high-impact outcomes from marine ice-sheet instability (MISI) and marine ice-cliff instability (MICI) in Antarctica. Under high emissions, a collapse of vulnerable Antarctic sectors could add up to 0.5 m by 2100 and several meters by 2300. The NASA Sea Level Change Portal provides interactive tools to explore these scenarios regionally.
Long-Term Commitment Beyond 2100
Sea level rise is effectively irreversible on human timescales. Even under net-zero emissions, thermal expansion and ice-sheet response continue for centuries. The IPCC estimates that limiting warming to 1.5°C commits the planet to 2–3 m of sea level rise over 2000 years; 2°C commits to 2–6 m; and 3°C commits to 4–10 m. This “sea level commitment” necessitates long-term adaptation planning beyond the 2100 horizon.
Impacts on Coastal Systems and Communities
The consequences of sea level rise cascade across physical, ecological, and socioeconomic systems:
Coastal Flooding and Erosion
Higher baseline sea levels amplify storm surges, high-tide flooding (nuisance flooding), and wave attack. Events that historically occurred once per century may become annual by 2100 in many locations. The U.S. NOAA reports that high-tide flooding frequency has doubled since 2000 along many coastlines. Erosion rates increase as the shoreface adjusts to the new water level, threatening beaches, dunes, and cliff-top infrastructure.
Saltwater Intrusion and Groundwater Salinization
Rising seas push the freshwater-saltwater interface inland, contaminating coastal aquifers critical for drinking water and agriculture. This is especially acute in small island developing states (SIDS) and heavily populated deltas like the Mekong, Ganges-Brahmaputra, and Nile.
Ecosystem Loss and Transformation
Coastal wetlands (mangroves, salt marshes, seagrasses) provide carbon sequestration, storm protection, and fisheries habitat. They can migrate landward if space permits, but “coastal squeeze” from development and hard defenses prevents this. The IPCC projects 20–90% loss of coastal wetlands by 2100 depending on emissions and accommodation space.
Socioeconomic Disparities and Climate Justice
Vulnerability is highly uneven. Low-income communities, indigenous peoples, and SIDS contribute least to emissions but face disproportionate risks. The Maldives, Tuvalu, and Marshall Islands confront existential threats to sovereignty. In the U.S., historically redlined neighborhoods often occupy lower-elevation, flood-prone land, compounding environmental injustice.
Adaptation Strategies: Protect, Accommodate, Advance, Retreat
Effective adaptation requires a portfolio approach tailored to local context:
Hard Engineering (Protection)
Seawalls, levees, surge barriers (e.g., Maeslantkering in Rotterdam, Thames Barrier in London) provide immediate defense but are costly, require maintenance, and can increase risk downstream or create false security. The Netherlands’ Delta Programme exemplifies adaptive delta management with flexible pathways.
Nature-Based Solutions (NbS)
Restoring mangroves, oyster reefs, salt marshes, and dunes attenuates waves, reduces erosion, and provides co-benefits (biodiversity, carbon storage, livelihoods). The “Living Shorelines” approach in the U.S. and “Building with Nature” in Indonesia demonstrate cost-effective NbS integration.
Accommodation and Advance
Elevating structures, flood-proofing infrastructure, amphibious architecture, and strategic land reclamation (e.g., Singapore, Hong Kong) allow continued occupation. Advance must account for future sea level rise to avoid maladaptation.
Managed Retreat and Relocation
When protection is infeasible or unjust, planned relocation reduces exposure. Examples include the Isle de Jean Charles (Louisiana, USA), Vunidogoloa (Fiji), and the Mekong Delta’s “living with floods” policy. Success requires community leadership, cultural preservation, and adequate finance.
Monitoring and Early Warning Systems
Continuous observation is critical for model validation and early warning. The Global Sea Level Observing System (GLOSS) coordinates tide gauges; the Copernicus Sentinel-6 Michael Freilich mission extends the satellite altimetry record. The Permanent Service for Mean Sea Level (PSMSL) archives quality-controlled tide-gauge data. Emerging technologies include GNSS reflectometry, coastal altimetry (SAR mode), and citizen-science water-level apps.
Economic Costs and Finance
Without adaptation, annual coastal flood damages could reach 0.3–9.3% of global GDP by 2100. The Global Commission on Adaptation estimates $1.8 trillion invested in adaptation by 2030 could yield $7.1 trillion in net benefits. Climate finance mechanisms (Green Climate Fund, Adaptation Fund) remain insufficient for SIDS and least developed countries. Innovative instruments like resilience bonds, parametric insurance, and debt-for-climate swaps are being piloted.
Governance and Policy Frameworks
International frameworks include the UNFCCC Paris Agreement (global stocktake includes loss and damage), the Sendai Framework for Disaster Risk Reduction, and the UN Convention on the Law of the Sea (UNCLOS) — where sea level rise challenges maritime boundaries and exclusive economic zones. National adaptation plans (NAPs) and integrated coastal zone management (ICZM) laws (e.g., India’s CRZ notifications, EU’s Marine Strategy Framework Directive) translate global goals into local action.
Sea Level Rise in the Indian Context
India’s 7,500 km coastline hosts 250 million people within 50 km of the shore. The Indian National Centre for Ocean Information Services (INCOIS) reports a mean sea level rise of 1.7 mm/yr (1993–2020), with higher rates in the Bay of Bengal. The Sundarbans, Mumbai, Chennai, and Kochi are hotspots. The Coastal Regulation Zone (CRZ) Notification 2019 and National Action Plan on Climate Change (NAPCC) guide adaptation, but enforcement gaps persist. Community-based mangrove restoration in Gujarat and Odisha showcases successful NbS.
Key Research Frontiers
Critical uncertainties remain in:
- Antarctic ice-sheet dynamics (MISI, MICI, hydrofracturing)
- Greenland ice-sheet surface mass balance and ice-ocean interaction
- Glacier response timescales and regional projections
- Vertical land motion at sub-kilometer resolution
- Compound flooding (sea level + rainfall + river discharge)
- Socioeconomic tipping points and migration dynamics
Programs like ISMIP6 (Ice Sheet Model Intercomparison Project for CMIP6) and PROTECT (Projecting Sea-Level Rise: From Ice Sheets to Local Implications) aim to reduce these uncertainties.
Conclusion: Acting Now for a Resilient Future
Sea level rise is not a distant threat — it is unfolding today, accelerating, and locking in centuries of change. The scientific evidence is unequivocal: deep, rapid, and sustained emissions reductions are the single most effective way to limit long-term sea level rise. Simultaneously, transformative adaptation — rooted in equity, informed by local knowledge, and financed at scale — must protect the most vulnerable. As Dr. Krishnanand emphasizes in his lecture series for UPSC Geography aspirants, understanding the physical geography of sea level changes is foundational for crafting policies that safeguard coastal futures. The choices made this decade will reverberate for millennia.
Frequently Asked Questions
The two primary causes of sea level rise are thermal expansion of seawater as it warms and the addition of water from melting land ice (glaciers, Greenland Ice Sheet, Antarctic Ice Sheet). Thermal expansion contributed about 42% and land ice melt about 44% of observed rise during 2006–2018.
Global mean sea level has risen approximately 20 centimeters (about 8 inches) since 1900. The rate has accelerated from ~1.4 mm/year in the 20th century to ~3.7 mm/year during 2006–2018, based on satellite altimetry and tide-gauge records.
Under the IPCC AR6 scenarios, global mean sea level rise by 2100 (relative to 1995–2014) ranges from 0.28–0.55 m (very low emissions, SSP1-1.9) to 0.63–1.01 m (very high emissions, SSP5-8.5). Higher values are possible if Antarctic ice-sheet instability accelerates.