Blog
Population Geography Diagrams: A Complete Guide for UPSC CSE Aspirants and Geography Students


Key Takeaways
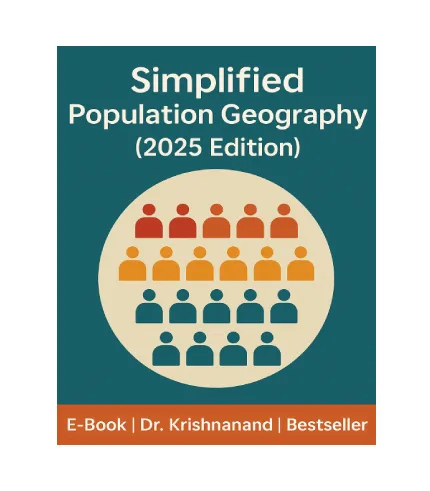
Population Geography diagrams are essential visual tools that transform complex demographic data into understandable formats for students and professionals alike. Whether you are preparing for UPSC CSE, pursuing undergraduate geography, or simply fascinated by human population dynamics, mastering these diagrams is critical. This guide walks you through understanding what makes Population Geography diagrams effective, the common challenges learners face, and how to choose the right resource—including the widely recommended Simplified Population Geography (2025 Edition) by Dr. Krishnanand.
- Population Geography diagrams bridge the gap between raw demographic data and conceptual clarity.
- UPSC CSE aspirants and CBCS geography students frequently cite diagrams as high-yield scoring areas.
- Dr. Krishnanand’s Simplified Population Geography (2025 Edition) integrates point-wise descriptions with diagrams, maps, and images for comprehensive learning.
- Choosing a resource with accurate, exam-oriented Population Geography diagrams saves hundreds of hours of self-study.
What Are Population Geography Diagrams and Why Do They Matter?
Population Geography diagrams encompass visual representations such as population pyramids, demographic transition models, migration flow charts, and settlement distribution maps. These diagrams are not merely illustrative—they are analytical instruments that help students interpret fertility rates, mortality trends, age-sex structures, and spatial population patterns. For anyone studying Population Geography diagrams, the ability to read, construct, and explain these visuals is a non-negotiable skill.
The Census of India, available at censusindia.gov.in, provides the primary dataset from which most Population Geography diagrams in the Indian academic context are derived. Understanding how to convert census data into diagrams is a competency explicitly tested in UPSC CSE Prelims and Mains, as well as in university examinations under the CBCS syllabus.
The Core Challenges Students Face with Population Geography Diagrams
Many learners struggle with Population Geography diagrams for three recurring reasons. First, textbook descriptions often lack step-by-step visual breakdowns, leaving students to reconstruct diagrams from memory during exams. Second, the sheer volume of data—fertility rates across decades, mortality coefficients, migration streams—can overwhelm without proper visual scaffolding. Third, outdated editions of standard textbooks present diagrams that do not reflect the latest census data or demographic shifts.
Dr. Krishnanand addresses these gaps directly. The Simplified Population Geography (2025 Edition) features point-wise highlighted descriptions alongside diagrams, maps, and images that make complex demographic patterns immediately comprehensible. This approach is particularly valuable for Population Geography diagrams where a single illustration may encode multiple variables—age structure, sex ratio, and dependency ratio simultaneously.
Why Diagram-Specific Learning Matters for UPSC and CBCS
UPSC CSE question papers consistently include direct questions on Population Geography diagrams, from sketching a population pyramid for India to analyzing the demographic transition model. The National Council of Educational Research and Training (NCERT), whose resources are accessible via ncert.nic.in, emphasizes diagram-based answers in both Prelims and Mains. Students who can reproduce accurate Population Geography diagrams with labeled axes, annotated data points, and analytical commentary consistently outperform those relying solely on textual descriptions.
How to Evaluate Resources for Learning Population Geography Diagrams
When selecting a resource focused on Population Geography diagrams, consider four criteria: accuracy of data, visual clarity, syllabus alignment, and pedagogical structure. Accuracy means the diagrams reflect the latest available census data and demographic surveys. Visual clarity demands that diagrams are legible, properly labeled, and accompanied by explanatory notes. Syllabus alignment ensures coverage of topics prescribed by CBSE, UGC, and UPSC. Pedagogical structure refers to whether the resource builds concepts progressively from basic to advanced.
Many aspirants end up purchasing multiple reference materials because no single resource covers all four criteria. The Simplified Population Geography (2025 Edition) by Dr. Krishnanand was specifically designed to meet all four benchmarks. Its point-wise highlighted descriptions, integrated diagrams, maps, and images are structured to align with the prescribed CBCS syllabus in geography, making it a focused and efficient study companion for Population Geography diagrams.
Why Simplified Population Geography (2025 Edition) by Dr. Krishnanand Stands Out
Authored by renowned scholar Dr. Krishnanand, Simplified Population Geography (2025 Edition) has earned its reputation as a bestseller among UPSC CSE aspirants, undergraduates, and geography enthusiasts. The book simplifies complex concepts without sacrificing academic rigor—a balance that is rare in Population Geography diagrams resources. Each chapter systematically builds understanding, from the nature and scope of population geography to the intricate dynamics of fertility, mortality, and migration.
The book covers essential chapters including Population Size, Distribution, and Growth, Population Dynamics, Population Composition, and Sources of Data with special reference to India. What sets this edition apart for Population Geography diagrams is the deliberate inclusion of visual elements—diagrams, maps, and images—that accompany every major concept. These are not decorative additions; they are integral to the learning architecture of the text.
For learners who need reliable, exam-oriented Population Geography diagrams, this e-book at geographyebooks.com offers a structured, affordable solution priced at 249. The 2025 edition ensures that all data and diagrams reflect the most current demographic information available.
Practical Study Strategies for Mastering Population Geography Diagrams
Merely reading Population Geography diagrams is insufficient; active practice is essential. Begin by tracing diagrams from the Simplified Population Geography (2025 Edition) and attempting to redraw them from memory. Annotate each diagram with the key data points it represents—for instance, a population pyramid should be labeled with specific percentage distributions for each age cohort.
Second, correlate diagrams with real-world data from sources like the World Bank, accessible at data.worldbank.org, to understand how Population Geography diagrams translate theoretical models into observed reality. Third, practice writing analytical explanations beneath each diagram, as UPSC and university exams reward both visual accuracy and textual interpretation.
Consistency matters more than intensity. Dedicating 30 minutes daily to reviewing and redrawing Population Geography diagrams from the Simplified Population Geography (2025 Edition) will yield measurable improvement within weeks. The book’s chapter-by-chapter structure—spanning pages 5 through 68 and beyond—allows for incremental, manageable study sessions.
Who Should Use This Resource
This resource is ideally suited for UPSC CSE aspirants who need exam-ready Population Geography diagrams, undergraduate geography students following the CBCS syllabus, and anyone with a genuine interest in understanding global demographic patterns. Dr. Krishnanand’s expertise ensures that Population Geography diagrams are presented at the right level of complexity—accessible to beginners yet thorough enough for advanced study.
The 2025 edition’s emphasis on Indian census data, National Sample Surveys, and vital statistics makes it particularly relevant for Indian academic and competitive examination contexts. Whether your goal is to score high marks in a university examination or to build a foundational understanding of population dynamics, the Simplified Population Geography (2025 Edition) delivers targeted, practical value.
Frequently Asked Questions
What are the most important Population Geography diagrams for UPSC CSE preparation?
The most frequently tested Population Geography diagrams include population pyramids, demographic transition models, migration transition models, and settlement distribution maps. Dr. Krishnanand’s Simplified Population Geography (2025 Edition) covers all these diagram types with point-wise descriptions and annotated visuals aligned with UPSC requirements.
Is the Simplified Population Geography (2025 Edition) suitable for beginners with no prior background in Population Geography diagrams?
Yes. The book is explicitly designed to simplify complex concepts for readers at all levels. It begins with foundational chapters such as the Nature and Scope of Population Geography and progressively advances to topics like Population Dynamics and Population Composition. The integrated diagrams and maps provide visual support that helps beginners grasp abstract demographic concepts quickly.
How does the Simplified Population Geography (2025 Edition) differ from older editions or other textbooks on Population Geography diagrams?
The 2025 edition incorporates the latest census data and demographic statistics, ensuring all Population Geography diagrams reflect current realities. Unlike older editions, this version features updated point-wise highlighted descriptions, enhanced diagrams, maps, and images that align with the prescribed CBCS syllabus. The comprehensive coverage of sources of data—including Census, Vital Statistics, and NSS—provides a level of detail that older editions and competing textbooks often lack.
Our Recommendation
📖 Part of our complete guide: Evolution of Geographical Thought: A Comprehensive Guide for UPSC Aspirants and Geography Enthusiasts
Frequently Asked Questions
What are the most important Population Geography diagrams for UPSC CSE preparation?
The most frequently tested Population Geography diagrams include population pyramids, demographic transition models, migration transition models, and settlement distribution maps. Dr. Krishnanand's Simplified Population Geography (2025 Edition) covers all these diagram types with point-wise descriptions and annotated visuals aligned with UPSC requirements.
Is the Simplified Population Geography (2025 Edition) suitable for beginners with no prior background in Population Geography diagrams?
Yes. The book is explicitly designed to simplify complex concepts for readers at all levels. It begins with foundational chapters such as the Nature and Scope of Population Geography and progressively advances to topics like Population Dynamics and Population Composition. The integrated diagrams and maps provide visual support that helps beginners grasp abstract demographic concepts quickly.
How does the Simplified Population Geography (2025 Edition) differ from older editions or other textbooks on Population Geography diagrams?
The 2025 edition incorporates the latest census data and demographic statistics, ensuring all Population Geography diagrams reflect current realities. Unlike older editions, this version features updated point-wise highlighted descriptions, enhanced diagrams, maps, and images that align with the prescribed CBCS syllabus. The comprehensive coverage of sources of data—including Census, Vital Statistics, and NSS—provides a level of detail that older editions and competing textbooks often lack.