Blog
development indicators: A Complete Guide for Geography Students and UPSC Aspirants


Updated: September 14, 2026
Leveraging Digital Geospatial Technologies for Modern Development Indicators
Recent advances in digital geospatial technologies have transformed the way development indicators are conceptualised, collected and analysed, especially for geography students and UPSC candidates. Traditional manual surveys and census data, while still foundational, now complement high‑resolution satellite imagery, drone mapping and real‑time mobile data streams, enabling a more granular view of spatial disparities across Indian states. By integrating these satellite‑derived metrics with GIS‑based spatial analysis, analysts can compute location‑specific scores for indicators such as rural electrification, water‑source proximity, and educational facility density, thereby addressing the granularity gap highlighted by recent search trends for “development indicators geography” and “indicators of development in india”. Platforms such as Sentinel‑2, Landsat‑8 and the Indian Remote Sensing (IRS) archives provide near‑daily updates on land‑use change, night‑light intensity and agricultural vegetation indices, which can be translated into proxy indicators for economic activity, infrastructure access and poverty levels. Moreover, open‑source tools like QGIS, Google Earth Engine and Python libraries (e.g., geopandas, rasterio) democratise the process, allowing aspirants to reproduce national‑level development dashboards without expensive proprietary software. This shift also supports dynamic monitoring of policy interventions — for instance, tracking the impact of the Pradhan Mantri Gram Sadak Yojana (PMGSY) on road connectivity through before‑after satellite images — thereby offering a evidence‑based feedback loop for administrators and scholars. Consequently, the integration of digital geospatial tools not only enriches the classical definition of development indicators but also aligns them with the data‑driven expectations of contemporary academic and competitive examination contexts. For UPSC aspirants, mastering these digital techniques not only improves answer precision in geography‑based questions but also equips them with a competitive edge in interpreting quantitative data from government reports, census releases and satellite‑derived indices, thereby strengthening their overall preparation for the civil services examination.
Additional FAQs
How can satellite imagery and GIS be used to calculate development indicators for Indian states?
Satellite imagery provides up‑to‑date land‑cover, night‑light and vegetation data, which are imported into GIS platforms. By overlaying these layers with administrative boundaries and demographic datasets, analysts can derive location‑specific scores for indicators such as rural electrification, water‑source proximity, road density and agricultural productivity, enabling nuanced state‑level development assessments.
Which development indicators are most relevant for assessing India's progress toward the UN Sustainable Development Goals in 2025?
Key indicators include the proportion of the population with access to electricity, safe drinking water, and sanitation; gender parity in education and employment; agricultural value added per capita; and the extent of poverty reduction. Tracking these metrics through satellite‑derived proxies and official statistics helps gauge India's alignment with the 2030 Agenda.
Updated: September 8, 2026
Multidimensional and Real‑Time Development Indicators: Emerging Trends for Geography and UPSC
In recent years, the discourse around development indicators has shifted from purely economic metrics to a more holistic, multidimensional framework that integrates social, environmental, and governance dimensions. For geography students and UPSC aspirants, understanding this evolution is crucial because examination questions increasingly focus on how indicators reflect spatial disparities and policy outcomes across India’s diverse regions.
One of the most significant updates is the alignment of national indicator sets with the United Nations Sustainable Development Goals (SDGs). India’s National Indicator Framework (NIF) now tracks over 300 indicators, many of which are disaggregated to the district level. This allows geographers to map progress on goals such as clean water and sanitation (SDG 6), affordable and clean energy (SDG 7), and climate action (SDG 13) using GIS tools. For instance, the Aspirational Districts Programme employs a composite index that combines health, education, agriculture, and infrastructure metrics, providing a ready‑made case study for analyzing intra‑state variation.
Another emerging angle is the use of big‑data sources—night‑time light satellite imagery, mobile phone call detail records, and crowdsourced platforms—to supplement traditional survey‑based indicators. These data streams offer near‑real‑time insights into economic activity, migration patterns, and service accessibility, especially in remote or conflict‑affected areas where conventional data collection is lagging. UPSC mains questions have started to ask candidates to evaluate the reliability and ethical implications of such alternative indicators.
Finally, the growing emphasis on climate‑resilient development has introduced indicators that measure adaptive capacity, such as the proportion of households with access to drought‑resilient crops or the density of early‑warning systems. Integrating these climate‑sensitive metrics into traditional development analyses helps students appreciate the interconnectedness of environmental sustainability and human well‑being, a theme that recurs in both geography papers and general studies.
For aspirants, the practical takeaway is to practice interpreting indicator dashboards, compare state‑level performance using publicly available NIF data, and critique the limitations of each metric—whether it be temporal lag, spatial granularity, or normative bias. Mastery of this nuanced indicator landscape not only boosts scores in geography and general studies papers but also equips future administrators with the evidence‑based mindset required for effective development planning.
Additional FAQs
What are the latest development indicators used in India's Aspirational Districts Programme?
The Aspirational Districts Programme uses a composite index that combines 49 indicators across five core sectors—health and nutrition, education, agriculture and water resources, financial inclusion and skill development, and basic infrastructure. Each indicator is normalized and weighted to produce a district‑level score, which is updated annually and made publicly available through the NITI Aayog dashboard.
How do development indicators differ between rural and urban areas in India?
Rural development indicators often emphasize access to potable water, sanitation, rural electrification, agricultural productivity, and livelihood diversification, while urban indicators focus on housing quality, air‑water pollution levels, public transport availability, slum prevalence, and service delivery efficiency. Consequently, composite scores for rural districts tend to highlight basic service gaps, whereas urban metrics reveal challenges related to congestion, environmental stress, and informal settlement growth.
Understanding development indicators is essential for anyone studying population geography, preparing for competitive exams like UPSC CSE, or analyzing demographic trends in academic research. These metrics quantify progress across health, education, income, and quality of life — but the sheer volume of indices, data sources, and methodological debates can overwhelm even dedicated learners.
- development indicators measure multidimensional progress beyond GDP, including health, education, and living standards.
- Key indices include the Human Development Index (HDI), Multidimensional Poverty Index (MPI), and Gender Development Index (GDI).
- Reliable data sources: Census of India, National Sample Survey (NSS), Sample Registration System (SRS), and UN/World Bank databases.
- For UPSC and CBCS geography syllabi, mastering these indicators requires both conceptual clarity and India-specific application.
- A structured textbook with diagrams, maps, and point-wise explanations accelerates retention and exam performance.
Why development indicators Matter in Population Geography
Population geography examines the spatial distribution, composition, and dynamics of human populations. Development indicators serve as the analytical bridge between raw demographic data and policy-relevant insights. They allow geographers to answer critical questions: Why do fertility rates differ across districts? How does female literacy correlate with infant mortality? What explains the demographic dividend in southern Indian states versus persistent high fertility in parts of the Hindi belt?
The Census of India 2011 recorded a national literacy rate of 74.04%, but disaggregating by state reveals Kerala at 94% and Bihar at 61.8% — a gap that development indicators like the Gender Parity Index and Gross Enrollment Ratio help explain. These metrics are not abstract; they directly inform resource allocation, electoral delimitation, and welfare scheme targeting.
Core Categories of development indicators Every Student Must Know
Health and Mortality Metrics
Life expectancy at birth, infant mortality rate (IMR), under-five mortality rate (U5MR), and maternal mortality ratio (MMR) form the health pillar. India’s IMR declined from 57 per 1,000 live births in 2005-06 (NFHS-3) to 35.2 in 2019-21 (NFHS-5), reflecting improved immunization and institutional delivery coverage. The Sample Registration System (SRS) provides annual sub-national estimates, making it indispensable for geographical analysis.
Education and Literacy Indices
Beyond crude literacy rates, geographers use Gross Enrollment Ratio (GER), Net Enrollment Ratio (NER), Gender Parity Index (GPI), and mean years of schooling. The National Education Policy 2020 targets 100% GER in secondary education by 2030 — a benchmark tracked through Unified District Information System for Education (UDISE+) data.
Economic and Living Standard Measures
Per capita income, poverty headcount ratio, Multidimensional Poverty Index (MPI), and access to basic services (sanitation, electricity, clean cooking fuel) capture economic well-being. NITI Aayog’s MPI 2023 report shows India’s multidimensionally poor population dropped from 24.85% (2015-16) to 14.96% (2019-21), with the steepest declines in Uttar Pradesh, Bihar, and Madhya Pradesh.
Composite Indices: HDI and Beyond
The Human Development Index (HDI), published annually by UNDP since 1990, combines life expectancy, education (mean and expected years of schooling), and GNI per capita. India’s HDI value rose from 0.429 (1990) to 0.644 (2022), placing it 134th of 193 countries. Variants like the Inequality-adjusted HDI (IHDI) and Planetary Pressures-adjusted HDI (PHDI) add distributional and environmental dimensions critical for geographical analysis.
Data Sources: From Census to Big Data
Credible development indicators rest on robust data infrastructure. For Indian geography, three pillars dominate:
- Census of India: Decennial, universal coverage; provides population size, distribution, literacy, workforce participation, migration, and housing amenities at village/ward level.
- National Sample Survey (NSS): Quinquinquennial household surveys on consumption, employment, health, education — enabling poverty and inequality estimation.
- Civil Registration System (CRS) & Sample Registration System (SRS): Continuous vital statistics on births, deaths, fertility, and mortality with rural-urban and state-level disaggregation.
Emerging sources include NFHS (health/nutrition), PLFS (employment), ASER (learning outcomes), and satellite-derived nightlights data for proxy economic activity. The UNDP Human Development Report and World Bank Open Data portals offer cross-country comparable series for comparative geography.
Common Pitfalls When Studying development indicators
Many aspirants memorize definitions but struggle with application. Three recurring issues:
1. Confusing Stock vs. Flow Indicators
Literacy rate is a stock (accumulated outcome); enrollment ratio is a flow (current input). Policies targeting flows take decades to shift stocks — a nuance examiners test.
2. Ignoring Spatial Heterogeneity
National averages mask district-level disparities. Aspirational Districts Programme targets 112 underdeveloped districts using 49 indicators across health, education, agriculture, and infrastructure. Geography answers demand map-based reasoning, not just national totals.
3. Overlooking Methodological Changes
HDI methodology revised in 2010 (geometric mean, new goalposts); MPI Alkire-Foster method weights dimensions equally. Knowing why indices change prevents outdated comparisons.
How to Choose the Right Study Resource
With dozens of geography textbooks and PDFs circulating, evaluate resources on five criteria:
- Syllabus alignment: Covers CBCS-prescribed topics (nature/scope, data sources, population dynamics, composition, policies).
- India-centric data: Uses Census, NSS, SRS, NFHS — not just global aggregates.
- Visual learning aids: Diagrams, population pyramids, choropleth maps, and flowcharts for migration streams.
- Point-wise structure: Enables quick revision; critical for last-mile exam preparation.
- Updated edition: Incorporates NFHS-5 (2019-21), Census 2011 (latest available), NITI Aayog MPI 2023, and policy shifts like Mission Shakti, Poshan Abhiyaan.
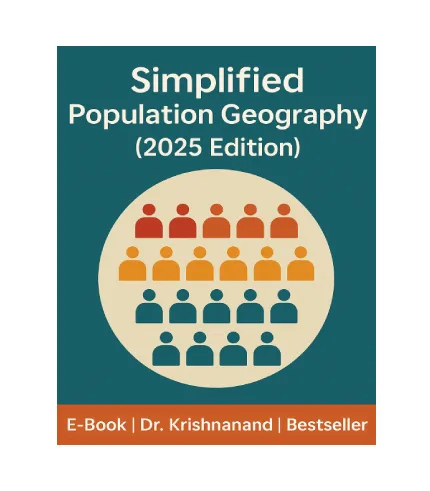
Simplified Population Geography (2025 Edition) by Dr. Krishnanand meets all five criteria. Its chapter on Sources of Data with special reference to India (Chapter 2) walks through Census, Vital Statistics, and NSS with worked examples, while Chapter 3 on Population Size, Distribution, and Growth links determinants to spatial patterns using district-level maps.
Practical Study Plan for Mastering development indicators
Week 1: Foundations
Read Chapter 1 (Nature & Scope) and Chapter 2 (Data Sources). Create a one-page matrix: Source | Frequency | Coverage | Key Variables | Limitations. Memorize Census 2011 highlights: population 1.21B, decadal growth 17.7%, sex ratio 943, literacy 74.04%.
Week 2: Dynamics & Composition
Chapter 3 (Size, Distribution, Growth) and Chapter 4 (Fertility, Mortality, Migration). Practice calculating Crude Birth Rate, Total Fertility Rate, and Net Migration Rate from hypothetical data. Map the demographic transition stages across Indian states using SRS 2020 TFR data (Bihar 3.0, Kerala 1.5).
Week 3: Indicators & Policies
Focus on Chapter 5 (Composition & Characteristics) and policy chapters. Build flashcards for 20 core development indicators: definition, formula, latest India value, source, and one geographical insight each. Example: Sex Ratio at Birth (SRB) = 929 (SRS 2020); lowest in Haryana (843), highest in Chhattisgarh (958) — reflects son preference geography.
Week 4: Integration & Mock Questions
Solve previous UPSC Geography Optional and GS Paper 1 questions on population. Write 150-word answers linking development indicators to regional disparities: “Explain the correlation between female literacy and TFR using district-level evidence from NFHS-5.” The e-book’s point-wise highlighted descriptions make this synthesis efficient.
Why Simplified Population Geography (2025 Edition) Stands Out
Dr. Krishnanand’s textbook is prescribed in CBCS geography syllabi across Indian universities — a signal of academic rigor. The 2025 edition integrates NFHS-5 findings, NITI Aayog’s latest MPI, and updated SRS bulletins, ensuring your development indicators knowledge reflects current data, not decade-old textbook tables. Diagrams like the demographic transition model adapted for Indian states, population pyramid comparisons (Kerala vs. Bihar), and migration flow maps translate abstract concepts into visual memory anchors.
At ₹249 for the e-book format, it delivers syllabus-complete coverage at a fraction of printed textbook costs. The downloadable sample lets you verify the point-wise style and diagram quality before committing.
Frequently Asked Questions
What are the most important development indicators for UPSC Geography?
Focus on HDI components (life expectancy, mean/expected years of schooling, GNI per capita), MPI dimensions (health, education, living standards), and India-specific metrics: TFR, IMR, MMR, literacy rate, sex ratio, work participation rate, and urbanization level. NFHS-5 and SRS 2020 are the primary current sources.
How do development indicators differ from economic indicators?
Economic indicators (GDP, per capita income, industrial output) measure production and income. Development indicators are broader, capturing health, education, equity, and quality of life. HDI was explicitly designed to complement — not replace — GDP by adding human capability dimensions.
Which data source is most reliable for district-level development indicators in India?
Census 2011 remains the only universal district-level source. For recent estimates, NFHS-5 (district factsheets), UDISE+ (education), and HMIS (health facility data) provide proxy indicators. Aspirational Districts dashboard aggregates 49 indicators monthly for 112 districts.
Our Recommendation
Frequently Asked Questions
What are the most important development indicators for UPSC Geography?
Focus on HDI components (life expectancy, mean/expected years of schooling, GNI per capita), MPI dimensions (health, education, living standards), and India-specific metrics: TFR, IMR, MMR, literacy rate, sex ratio, work participation rate, and urbanization level. NFHS-5 and SRS 2020 are the primary current sources.
How do development indicators differ from economic indicators?
Economic indicators (GDP, per capita income, industrial output) measure production and income. Development indicators are broader, capturing health, education, equity, and quality of life. HDI was explicitly designed to complement — not replace — GDP by adding human capability dimensions.
Which data source is most reliable for district-level development indicators in India?
Census 2011 remains the only universal district-level source. For recent estimates, NFHS-5 (district factsheets), UDISE+ (education), and HMIS (health facility data) provide proxy indicators. Aspirational Districts dashboard aggregates 49 indicators monthly for 112 districts.