Blog
Development Indicators: Comprehensive Guide to Measuring Social Economic Environmental Progress

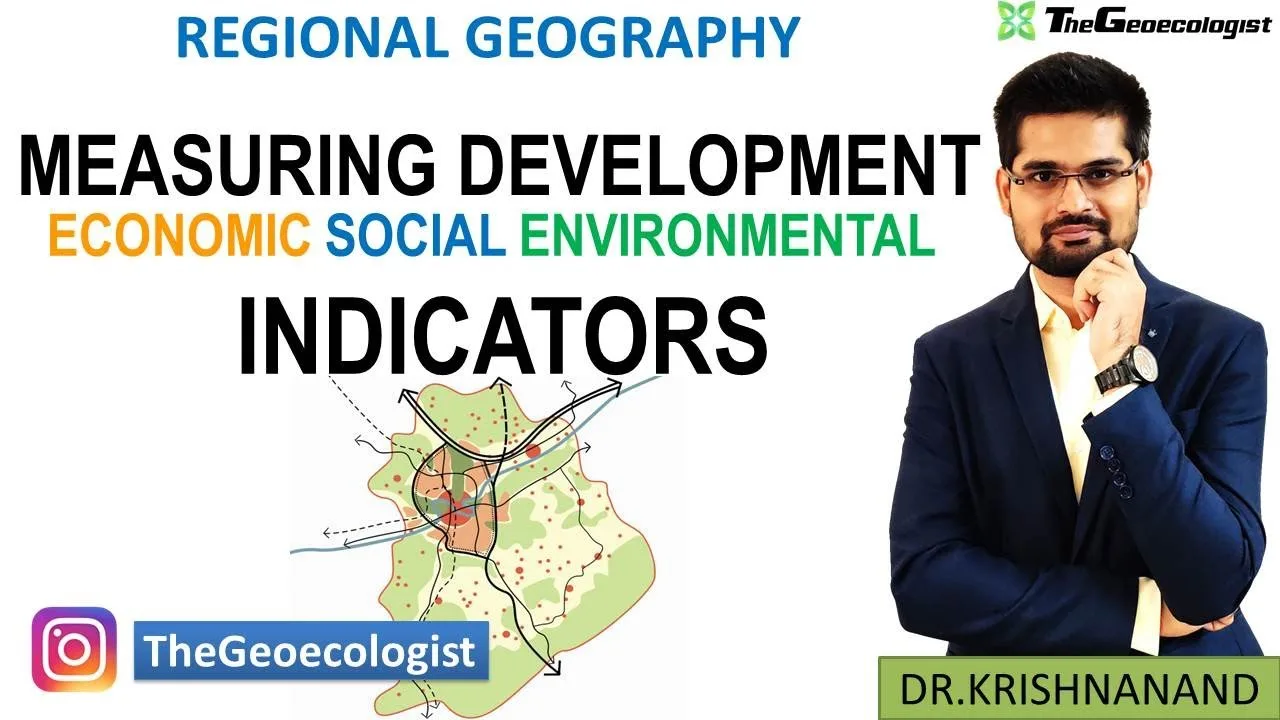
Table of Contents
- Why Measure Development: Beyond Economic Growth
- The Limitations of Single-Metric Approaches
- The Evolution of Development Measurement
- Social Development Indicators: Measuring Human Well-Being
- Education Metrics as Core Development Indicators
- Health and Longevity Development Indicators
- Gender Equality and Poverty Development Indicators
- Economic Development Indicators: Wealth, Distribution, and Structure
- Income and Output Development Indicators
- Inequality Measurement: Gini Coefficient and Palma Ratio
- Employment Structure and Economic Transformation
- Environmental Development Indicators: Sustainability and Planetary Boundaries
- Climate and Energy Development Indicators
- Natural Resource Management and Biodiversity
- Environmental Performance Index and Composite Metrics
- Interconnectedness of Development Indicators: Systems Thinking
- Climate-Poverty-Health Nexus
- Inequality-Education-Health Feedback Loops
- Composite Indices: Integrating Dimensions
- Relevance for UPSC Geography Optional and Competitive Examinations
- Case Studies and Application
- Answer Writing Strategy
- Emerging Trends in Development Measurement
- Big Data and Real-Time Development Indicators
- Well-Being and Subjective Development Indicators
- Inequality-Adjusted and Distribution-Sensitive Metrics
- Conclusion: Toward Holistic Development Assessment
Development indicators serve as the foundational framework for assessing progress across nations and regions, moving beyond simplistic economic metrics to capture the multidimensional nature of human advancement. For geography students, policymakers, and researchers preparing for competitive examinations like the UPSC Geography Optional, mastering these development indicators is essential to analyze regional disparities, evaluate policy outcomes, and design inclusive strategies. This comprehensive guide explores the key social, economic, and environmental development indicators, their interconnectedness, and their practical applications in regional geography and sustainable development planning.
- Development indicators encompass social, economic, and environmental metrics that collectively measure holistic progress beyond GDP.
- The Human Development Index (HDI), Gini coefficient, and Ecological Footprint are among the most widely used composite development indicators globally.
- Social development indicators like literacy rates, life expectancy, and gender parity reveal inequalities hidden by economic growth figures alone.
- Environmental development indicators such as carbon footprint, renewable energy share, and biodiversity loss are critical for assessing sustainability.
- For UPSC aspirants, integrating these development indicators into answers demonstrates comprehensive understanding of regional geography applications.
Why Measure Development: Beyond Economic Growth
The measurement of development helps policymakers and geographers assess progress, identify inequalities, and design inclusive strategies. Traditional metrics like Gross Domestic Product (GDP) often fail to capture holistic well-being, prompting the need for composite development indicators that reflect social equity, economic resilience, and environmental sustainability. As Dr. Krishnanand emphasizes in his lecture for TheGeoecologist, development is a multidimensional concept extending beyond mere economic growth to encompass improvements in quality of life, equity, and long-term sustainability.
The Limitations of Single-Metric Approaches
Relying solely on GDP per capita as a development indicator presents significant shortcomings. GDP ignores income distribution, environmental degradation, unpaid care work, and the informal economy—which constitutes over 60% of employment in many developing nations according to International Labour Organization estimates. Moreover, GDP treats defensive expenditures (pollution cleanup, crime prevention) as positive contributions, while depletion of natural capital goes unaccounted. These limitations catalyzed the creation of more nuanced development indicators beginning in the 1990s.
The Evolution of Development Measurement
The paradigm shift toward multidimensional development indicators gained momentum with the United Nations Development Programme’s launch of the Human Development Index in 1990. Championed by economists Mahbub ul Haq and Amartya Sen, the HDI introduced a revolutionary concept: development means expanding people’s choices and capabilities, not just increasing national income. This capability approach fundamentally reshaped how development indicators are constructed and interpreted worldwide.
Social Development Indicators: Measuring Human Well-Being
Social development indicators reflect the quality of life, access to basic services, and human well-being across populations. These development indicators highlight disparities often concealed by purely economic metrics, revealing where growth fails to translate into improved living conditions.
Education Metrics as Core Development Indicators
Education-focused development indicators include adult literacy rates, gross enrollment ratios across primary, secondary, and tertiary levels, and gender parity indices. According to UNESCO Institute for Statistics data, global adult literacy reached 86.7% in 2022, yet sub-Saharan Africa lags at 67%. The Gender Parity Index for primary enrollment stands at 0.99 globally, indicating near-parity, but drops to 0.88 in secondary education for low-income countries. These development indicators directly correlate with future economic productivity and civic participation.
Health and Longevity Development Indicators
Health-related development indicators encompass life expectancy at birth, infant mortality rate (IMR), under-five mortality rate, maternal mortality ratio, and access to healthcare facilities. Global life expectancy reached 73.4 years in 2019 (World Bank), but ranges from 54 years in Central African Republic to 85 years in Japan. The infant mortality rate—a sensitive development indicator of healthcare system effectiveness—stands at 27 deaths per 1,000 live births globally, versus 2 in Japan and 78 in Sierra Leone. These stark contrasts demonstrate why health development indicators are indispensable for identifying systemic failures.
Gender Equality and Poverty Development Indicators
The Gender Development Index (GDI) and Gender Inequality Index (GII) serve as specialized development indicators measuring disparities in reproductive health, empowerment, and labor market participation. The Multidimensional Poverty Index (MPI), developed by Oxford Poverty and Human Development Initiative (OPHI) and UNDP, captures acute deprivations in health, education, and living standards across 10 indicators. As of 2023, 1.1 billion people across 110 countries live in multidimensional poverty—far exceeding income-based poverty estimates. These development indicators reveal that high GDP can coexist with severe gender inequality and multidimensional poverty, as seen in several resource-rich nations.
Economic Development Indicators: Wealth, Distribution, and Structure
Economic development indicators measure wealth generation, employment patterns, infrastructure development, and distributional equity. While GDP remains a benchmark, modern development indicators incorporate inequality adjustments and structural transformation metrics.
Income and Output Development Indicators
Gross National Income (GNI) per capita (PPP-adjusted) serves as the primary income-based development indicator, reflecting average purchasing power. The World Bank classifies economies into four income groups using GNI per capita thresholds: low ($1,135 or less), lower-middle ($1,136–$4,465), upper-middle ($4,466–$13,845), and high ($13,846 or more) as of FY2024. However, the Inequality-Adjusted Human Development Index (IHDI) discounts HDI values by inequality levels—revealing that global HDI loses 19.4% of its value when adjusted for inequality, with Sub-Saharan Africa losing 31.7%.
Inequality Measurement: Gini Coefficient and Palma Ratio
The Gini coefficient remains the most widely cited inequality development indicator, ranging from 0 (perfect equality) to 1 (maximum inequality). According to World Bank data, South Africa (0.63) and Brazil (0.53) exhibit extreme inequality, while Slovenia (0.24) and Czech Republic (0.25) demonstrate relative equality. The Palma Ratio—comparing the top 10% income share to the bottom 40%—has gained traction as a more intuitive development indicator for policy discussions. These inequality development indicators are crucial because high inequality undermines social cohesion, reduces growth sustainability, and limits poverty reduction effectiveness.
Employment Structure and Economic Transformation
Sectoral employment distribution serves as a structural development indicator of economic modernization. The Clark-Fisher model predicts a shift from primary (agriculture) to secondary (manufacturing) to tertiary (services) dominance as development progresses. In 2022, high-income economies averaged 1.4% agricultural employment versus 49% in low-income economies (ILO). The share of manufacturing in GDP—another key development indicator—peaked at 30-35% in East Asian “tiger economies” during their rapid growth phases, compared to 10-15% in many African nations today. These structural development indicators inform industrial policy and diversification strategies.
Environmental Development Indicators: Sustainability and Planetary Boundaries
Sustainable development demands balancing growth with ecological preservation. Environmental development indicators evaluate how nations manage natural capital, mitigate climate change, and build resilience against environmental shocks.
Climate and Energy Development Indicators
Per capita CO2 emissions serve as a critical climate development indicator, ranging from 0.1 tonnes in Burundi to 15+ tonnes in Gulf states and the United States (Global Carbon Atlas, 2022). The renewable energy share in total final energy consumption—tracked by SDG 7.2—reached 19.1% globally in 2020, but varies from 85% in Norway to under 5% in several Middle Eastern nations. Carbon intensity of GDP (kg CO2 per $ GDP) acts as a decoupling development indicator, showing whether economic growth is becoming cleaner. These environmental development indicators are central to Paris Agreement commitments and net-zero pathways.
Natural Resource Management and Biodiversity
The Ecological Footprint—measuring humanity’s demand on nature against Earth’s biocapacity—revealed a global overshoot of 1.7 Earths in 2022 (Global Footprint Network). Deforestation rates, tracked via satellite by FAO’s Global Forest Resources Assessment, show 4.7 million hectares lost annually (2010-2020). The Red List Index, maintained by IUCN, tracks extinction risk trends across species groups. Water stress indicators (freshwater withdrawal as % of available resources) exceed 70% in 17 countries, signaling severe scarcity. These environmental development indicators demonstrate that current development trajectories frequently breach planetary boundaries.
Environmental Performance Index and Composite Metrics
The Environmental Performance Index (EPI), produced biennially by Yale and Columbia universities, ranks 180 countries on 40 performance indicators across 11 issue categories. The 2022 EPI ranked Denmark, United Kingdom, and Finland highest, while India, Myanmar, and Vietnam ranked lowest. The EPI serves as a comprehensive environmental development indicator for cross-country benchmarking and policy prioritization. Similarly, the Sustainable Development Goals Index tracks progress across all 17 SDGs using over 100 development indicators, providing the most holistic assessment framework to date.
Interconnectedness of Development Indicators: Systems Thinking
Development indicators do not operate in isolation; they form complex, dynamic systems where social progress relies on economic stability, which in turn depends on environmental health. Understanding these interlinkages is essential for effective policy design and regional planning.
Climate-Poverty-Health Nexus
Climate change (environmental development indicator) exacerbates poverty (social development indicator) by reducing agricultural yields—increasing food insecurity for 828 million people globally (FAO, 2022). Heat stress reduces labor productivity, particularly in agriculture and construction, lowering incomes for vulnerable populations. Vector-borne disease ranges expand with warming temperatures, increasing malaria and dengue incidence—directly affecting health development indicators. This nexus demonstrates why siloed policy approaches fail.
Inequality-Education-Health Feedback Loops
Economic inequality (Gini coefficient development indicator) limits access to quality education and healthcare, perpetuating social disparities across generations. Children in the poorest quintile are 3-4 times more likely to be stunted than those in the richest quintile (UNICEF). Low educational attainment reduces future earning potential, reinforcing income inequality. Breaking these cycles requires coordinated interventions across multiple development indicators simultaneously.
Composite Indices: Integrating Dimensions
The Human Development Index (HDI), combining income (GNI per capita), education (mean/expected years of schooling), and health (life expectancy), exemplifies the integration of development indicator dimensions. The 2021/22 Human Development Report introduced the Planetary Pressures-adjusted HDI (PHDI), discounting HDI values by per capita CO2 emissions and material footprint. Bhutan’s Gross National Happiness Index prioritizes ecological diversity, cultural resilience, and psychological well-being alongside economic output—offering an alternative development indicator framework. Kerala, India, achieves HDI 0.782 (high human development) despite modest per capita income, demonstrating how social development indicators can outpace economic ones through deliberate policy choices.
Relevance for UPSC Geography Optional and Competitive Examinations
For UPSC aspirants, mastering development indicators is essential to address questions on regional planning, sustainable development, global inequalities, and human geography. The UPSC Geography Optional syllabus explicitly covers “Concepts of development and underdevelopment,” “Human Development Index,” “Physical Quality of Life Index,” and “Sustainable development”—all requiring fluency with specific development indicators and their interpretation.
Case Studies and Application
Successful answers integrate development indicators with concrete case studies. Kerala’s “Kerala Model” achieves near-universal literacy (96.2%), life expectancy (77 years), and low IMR (6) through historic investments in public education and healthcare—despite per capita income below national average. Bhutan’s GNH framework uses 33 development indicators across 9 domains, influencing policy screening tools. The BRICS nations’ New Development Bank finances projects evaluated against environmental and social development indicators. The Aspirational Districts Programme in India tracks 49 development indicators across health, education, agriculture, and infrastructure for 112 backward districts—showing granular application.
Answer Writing Strategy
When addressing development indicator questions, structure responses with: (1) Definition and theoretical basis of key development indicators, (2) Comparative data across regions/countries with recent statistics, (3) Critical evaluation of strengths and limitations, (4) Policy implications and alternative frameworks, (5) Relevant case studies with specific development indicator values. Cite authoritative sources: UNDP Human Development Reports, World Bank World Development Indicators, UN SDG Reports, and peer-reviewed journals.
Emerging Trends in Development Measurement
The landscape of development indicators continues evolving with methodological innovations and new data sources.
Big Data and Real-Time Development Indicators
Satellite nighttime lights data serves as a proxy development indicator for economic activity at subnational levels, enabling GDP estimation where official statistics are lacking. Mobile phone metadata reveals mobility patterns, social networks, and economic behavior. AI-processed satellite imagery tracks crop yields, urban expansion, and infrastructure development in near real-time. These novel development indicators complement traditional survey-based metrics, offering higher frequency and spatial granularity.
Well-Being and Subjective Development Indicators
The OECD Better Life Index incorporates 11 well-being dimensions including work-life balance, social connections, and civic engagement—measured through both objective and subjective development indicators. The World Happiness Report uses Gallup World Poll data on life evaluations (Cantril ladder), positive/negative affect, and social support. These subjective development indicators capture dimensions invisible to material metrics, gaining policy traction in New Zealand’s Wellbeing Budget and Scotland’s National Performance Framework.
Inequality-Adjusted and Distribution-Sensitive Metrics
Beyond IHDI, the World Inequality Database provides distributional national accounts—tracking income/wealth shares by percentile since 1980. The Multidimensional Inequality Framework (LSE/Oxfam) assesses inequalities across seven domains using 50+ development indicators. These advances enable “growth incidence curves” showing which income groups benefit from growth—essential for inclusive development policy.
Conclusion: Toward Holistic Development Assessment
Measuring development through integrated social, economic, and environmental development indicators enables balanced assessment of progress that single metrics cannot provide. As Dr. Krishnanand concludes, geographers must advocate for policies that reconcile growth with equity and sustainability. The evolution from GDP-centric to multidimensional development indicators reflects a deeper understanding of what constitutes genuine human advancement. For aspirants and practitioners alike, fluency with these development indicators—and their interconnections, limitations, and policy implications—is indispensable for navigating the complex challenges of 21st-century regional geography and sustainable development.
Enhance your preparation with authoritative resources: The Human Development Index methodology, Gini coefficient calculations, and UN Sustainable Development Goals framework provide foundational knowledge. Subscribe to TheGeoecologist YouTube channel for detailed lectures on Geography Optional, follow @thegeoecologist on Instagram, and visit thegeoecologist.com for comprehensive study materials.
Frequently Asked Questions
The three main categories of development indicators are social indicators (education, health, gender equality, poverty), economic indicators (GDP/GNI per capita, employment structure, income inequality, industrial growth), and environmental indicators (carbon footprint, renewable energy usage, natural resource management, climate resilience).
GDP alone is insufficient because it ignores income inequality, environmental degradation, unpaid care work, the informal economy, and treats defensive expenditures as positive contributions while natural capital depletion goes unaccounted. Composite development indicators like HDI and IHDI provide more nuanced assessments.
Development indicators are essential for UPSC Geography Optional as they appear explicitly in the syllabus under human development, sustainable development, and regional planning topics. Mastery enables data-driven answers with case studies like Kerala's HDI success, Bhutan's GNH framework, and India's Aspirational Districts Programme.