Blog
Ocean water salinity distribution: Complete Guide to Patterns, Factors & Study Resources

Understanding Ocean water salinity distribution is fundamental to grasping global ocean circulation, climate regulation, and marine ecosystem dynamics. Whether you’re preparing for UPSC CSE, pursuing a geography degree, or researching oceanographic processes, the spatial and vertical patterns of salinity — and the forces shaping them — form a core pillar of physical geography and oceanography syllabi worldwide.
- Salinity varies systematically across latitudes, ocean basins, and depth zones — driven by evaporation, precipitation, river runoff, ice formation/melt, and ocean currents.
- Key drivers include the hydrological cycle (E-P balance), atmospheric circulation cells, thermohaline circulation, and regional geography (enclosed seas, upwelling zones).
- Vertical structure reveals a surface mixed layer, a sharp halocline, and relatively uniform deep waters — critical for understanding water mass formation.
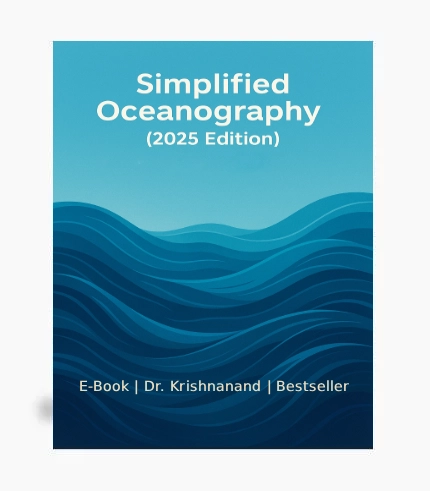
- Exam-focused resources like Dr. Krishnanand’s Simplified Oceanography (2025 Edition) distill these complex patterns into point-wise, diagram-rich chapters aligned with CBCS and UPSC syllabi.
Why Ocean Water Salinity Distribution Matters for Students and Researchers
The Ocean water salinity distribution is not merely an academic abstraction — it governs the density structure of the oceans, which in turn drives the global thermohaline circulation (often called the “global conveyor belt”). This circulation redistributes heat, regulates Earth’s climate, and influences weather patterns from monsoons to hurricanes. For UPSC aspirants, questions on salinity distribution, its controlling factors, and its link to ocean currents appear consistently in both Prelims and Mains. Undergraduate geography students following CBCS curricula encounter these topics in papers on oceanography, climatology, and physical geography.
Yet many learners struggle because standard textbooks either oversimplify (missing critical regional variations) or overwhelm with technical jargon without clear conceptual scaffolding. The ideal resource bridges this gap: it must be syllabus-aligned, visually rich with maps and diagrams, and structured for rapid revision — exactly what Simplified Oceanography (2025 Edition) by Dr. Krishnanand delivers through its dedicated chapters on ocean temperature, salinity, and water masses.
Global Patterns of Ocean Water Salinity Distribution
Latitudinal Zonation: The Evaporation-Precipitation Balance
Surface salinity follows a predictable latitudinal pattern governed by the net freshwater flux (evaporation minus precipitation, or E-P). The subtropical high-pressure belts (around 20°–30°N/S) experience high evaporation and low rainfall, producing surface salinities of 36–37 PSU (Practical Salinity Units) — the saltiest open-ocean waters. In contrast, the equatorial trough (ITCZ) and subpolar lows (50°–60°N/S) receive abundant precipitation, yielding lower surface salinities of 34–35 PSU and 32–33 PSU respectively.
This pattern is asymmetric: the Atlantic Ocean is saltier than the Pacific at all latitudes due to its narrower width, higher evaporation, and net export of freshwater to the Pacific via atmospheric transport. The Indian Ocean shows strong seasonal reversal driven by the monsoon system. These basin-scale differences are a favorite examination topic and are covered in detail in Chapter 5 (Ocean’s Temperature) and Chapter 6 (Ocean’s Salinity) of the 2025 edition.
Regional Anomalies: Enclosed Seas and Coastal Zones
Enclosed and semi-enclosed seas exhibit extreme salinity values that deviate sharply from open-ocean norms. The Red Sea averages 40–41 PSU due to intense evaporation and minimal freshwater input. The Baltic Sea, fed by massive river runoff and restricted exchange with the North Sea, drops to 5–15 PSU. The Mediterranean Sea sits at ~38–39 PSU, driving dense Mediterranean Outflow Water into the Atlantic. Coastal zones near major river mouths (Amazon, Ganges-Brahmaputra, Congo) show sharp salinity gradients — critical for estuarine ecology and sediment transport studies.
NOAA’s Ocean Salinity education portal provides authoritative data visualizations of these patterns, including Argo float measurements that have revolutionized our 3D understanding since the early 2000s.
Key Factors Influencing Ocean Water Salinity Distribution
1. Atmospheric Forcing: Evaporation, Precipitation, and Wind
The primary control on surface salinity is the local E-P balance. Trade wind zones enhance evaporation; the ITCZ and mid-latitude storm tracks deliver precipitation. Wind-driven Ekman transport also redistributes surface waters, advecting salty subtropical water poleward and fresher subpolar water equatorward. Seasonal shifts in the ITCZ — especially over the Indian Ocean — cause dramatic salinity fluctuations, a phenomenon well-documented in monsoon oceanography literature.
2. River Runoff and Ice Processes
Major rivers inject ~37,000 km³/year of freshwater into the oceans, creating vast low-salinity plumes. The Amazon alone contributes ~15% of global river discharge. In polar regions, sea ice formation rejects salt (brine rejection), increasing underlying water salinity and driving deep convection — a key mechanism for Antarctic Bottom Water formation. Conversely, summer ice melt injects freshwater, stratifying the upper ocean. These cryospheric processes are accelerating under climate change, with measurable freshening in the North Atlantic and Southern Ocean.
3. Ocean Circulation and Water Mass Advection
Salinity is not just locally forced — it is advected by currents. The Gulf Stream transports salty subtropical water northward; the Labrador Current carries fresher subpolar water southward. Upwelling zones (e.g., off Peru, Namibia) bring nutrient-rich, relatively high-salinity subsurface water to the surface. The global thermohaline circulation connects these regional signals: North Atlantic Deep Water (NADW) forms from saline surface water sinking in the Nordic Seas, while Antarctic Bottom Water (AABW) forms from brine-enriched shelf water. These water masses carry their salinity signatures across basins, creating the deep-ocean salinity field.
4. Mixing Processes: Eddy Diffusion and Double Diffusion
Mesoscale eddies (50–200 km scale) stir salinity laterally along isopycnals, while double-diffusive processes (salt fingering, diffusive convection) create fine-scale vertical structure in regions with strong temperature-salinity gradients. These processes, though subtle, determine the ultimate fate of salinity anomalies and are active research frontiers in physical oceanography.
Vertical Structure: From Surface to Abyss
The vertical profile of Ocean water salinity distribution typically shows three layers: a well-mixed surface layer (0–100 m) reflecting recent atmospheric forcing; a halocline (100–1000 m) where salinity changes rapidly with depth; and a deep layer (>1000 m) of relatively uniform salinity characteristic of the originating water mass. In the subtropical Atlantic, the surface layer is salty (~36.5 PSU), the halocline sharpens toward Antarctic Intermediate Water (AAIW, ~34.3 PSU at 800–1000 m), and NADW below shows ~34.9 PSU. In the North Pacific, the halocline is stronger due to fresh surface water overlying saltier deep water, inhibiting deep convection — a key reason why the Pacific lacks a northern deep water source.
Understanding these vertical profiles is essential for interpreting T-S (Temperature-Salinity) diagrams, a standard tool in oceanography that identifies water masses by their unique θ-S properties. Dr. Krishnanand’s e-book includes clear T-S diagram explanations and practice exercises tailored for examination questions.
How to Evaluate a Study Resource for Oceanography
When selecting a resource to master Ocean water salinity distribution and related topics, consider these criteria:
- Syllabus alignment: Does it cover the exact topics prescribed by UPSC, UGC-NET, or your university’s CBCS curriculum?
- Visual pedagogy: Are there maps of salinity distribution, T-S diagrams, cross-sections of ocean basins, and illustrations of thermohaline circulation?
- Point-wise structure: Can you rapidly revise key facts (e.g., salinity of major seas, factors affecting salinity, water mass characteristics) without wading through dense prose?
- Currency: Does it incorporate recent data (Argo era, satellite salinity missions like SMOS, Aquarius, SMAP)?
- Practice orientation: Are there previous year questions, model answers, or self-assessment questions?
The Simplified Oceanography (2025 Edition) scores highly on all five counts. Its chapters on Atlantic, Indian, and Pacific bottom topography (Chapters 2–4) provide the bathymetric context for understanding deep-water formation sites, while Chapters 5–6 deliver the temperature and salinity content with exam-ready formatting.
Practical Study Strategy: From Concepts to Exam Performance
Phase 1: Build the Mental Map
Start by sketching a world map from memory showing: (a) high-salinity subtropical gyres, (b) low-salinity equatorial and subpolar zones, (c) anomalous seas (Red Sea, Mediterranean, Baltic, Black Sea), and (d) major river plumes. Annotate with typical PSU values. This spatial framework anchors all subsequent detail.
Phase 2: Master the Factor Framework
Create a table linking each controlling factor (E-P, runoff, ice, advection, mixing) to its effect on surface vs. deep salinity, with one concrete example per factor. For instance: “Brine rejection during sea ice formation → increases salinity of shelf water → drives AABW formation → exports high-salinity signal to global abyss.”
Phase 3: Practice T-S Diagram Interpretation
Work through 5–10 T-S diagrams identifying water masses (NADW, AABW, AAIW, Red Sea Water, Mediterranean Water). Note the “salinity maximum” of Mediterranean Water at ~1000 m in the North Atlantic — a classic exam question.
Phase 4: Integrate with Circulation and Climate
Connect salinity to density-driven circulation: high salinity + low temperature = high density = deep convection. Trace the full conveyor belt pathway. Then link to climate: AMOC slowdown from freshwater forcing (Greenland melt) → reduced northward heat transport → regional cooling vs. global warming. This synthesis is what distinguishes top-tier Mains answers.
Why Simplified Oceanography (2025 Edition) Fits This Workflow
The e-book’s chapter sequence mirrors the logical learning progression: basin topography → temperature → salinity → water masses → currents. Its point-wise highlighted descriptions allow rapid scanning during revision. The included diagrams and maps are specifically designed for reproduction in descriptive answers — a skill UPSC examiners reward. At ₹249 for a comprehensive, syllabus-aligned digital resource updated for the 2025 cycle, it represents high value per study hour compared to generic textbooks costing 5–10× more.
Frequently Asked Questions
What is the average salinity of ocean water?
The global average surface salinity is approximately 35 PSU (35 grams of dissolved salts per kilogram of seawater). However, values range from 40 PSU in the Red Sea.
How does salinity affect ocean currents?
Salinity, together with temperature, determines seawater density. Dense (cold, salty) water sinks, driving deep thermohaline circulation. Surface currents are primarily wind-driven, but their density characteristics — set by salinity and temperature — determine whether they participate in deep-water formation.
Which ocean has the highest average salinity?
The Atlantic Ocean has the highest average surface salinity (~35.5 PSU) among the major basins, due to its higher net evaporation and limited freshwater input compared to the Pacific and Indian Oceans.
Our Recommendation
📖 Part of our complete guide: Evolution of Geographical Thought: A Comprehensive Guide for UPSC Aspirants and Geography Enthusiasts
Frequently Asked Questions
What is the average salinity of ocean water?
The global average surface salinity is approximately 35 PSU (35 grams of dissolved salts per kilogram of seawater). However, values range from <5 PSU in the Baltic Sea to >40 PSU in the Red Sea.
How does salinity affect ocean currents?
Salinity, together with temperature, determines seawater density. Dense (cold, salty) water sinks, driving deep thermohaline circulation. Surface currents are primarily wind-driven, but their density characteristics — set by salinity and temperature — determine whether they participate in deep-water formation.
Which ocean has the highest average salinity?
The Atlantic Ocean has the highest average surface salinity (~35.5 PSU) among the major basins, due to its higher net evaporation and limited freshwater input compared to the Pacific and Indian Oceans.