Blog
Data Processing: Class 12 Geography Guide

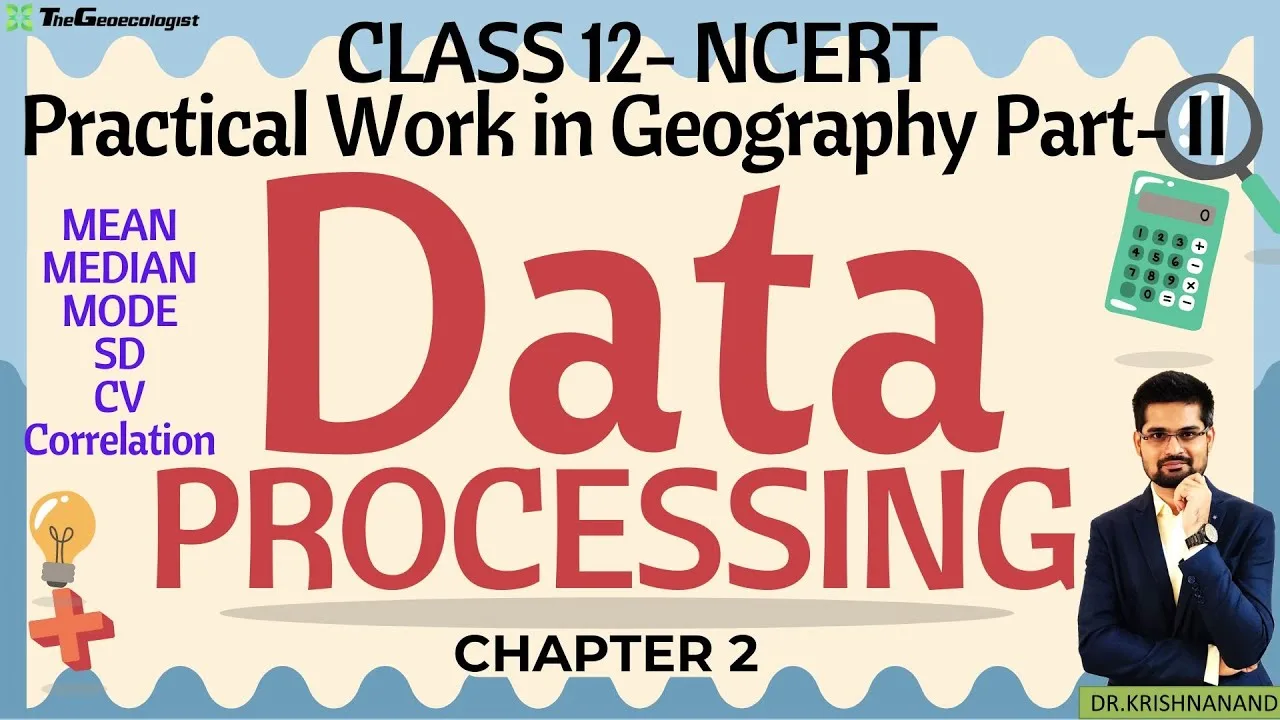
Table of Contents
- Understanding Data Processing in Geography
- Step‑by‑Step Guide to Data Processing Techniques
- 1. Data Collection Methods
- 2. Data Classification and Organization
- 3. Tabulation: Building Frequency Distribution Tables
- 4. Graphical Representation
- Practical Applications for Class 12 Students
- Why This Chapter Matters for Competitive Exams
- CUET & UGC NET
- UPSC
- Practical Skills Edge
- TheGeoecologist’s Approach to Teaching Data Processing
- Pro Tips for Effective Learning
- Practice Regularly
- Leverage Software
- Focus on Maps
- Conclusion
Data Processing is a core component of Practical Geography for Class 12 students, forming the backbone of spatial analysis and interpretation. In Chapter 2 of the NCERT Class 12 Practical Geography textbook, learners are introduced to the systematic methods of converting raw data into meaningful information. This article provides an in‑depth exploration of the concepts, techniques, and exam‑oriented strategies needed to master Data Processing for CBSE boards and competitive examinations such as CUET, UGC NET, and UPSC.
- Understand the stages of Data Processing: collection, classification, tabulation, and graphical representation.
- Learn to create frequency distribution tables, histograms, scatter plots, and thematic maps.
- Apply central tendency and dispersion measures to real‑world geographical datasets.
- Discover how Data Processing skills are tested in CUET, UGC NET, and UPSC geography papers.
- Get practical tips for using Excel, QGIS, and manual plotting techniques.
Understanding Data Processing in Geography
Data Processing involves transforming raw data into meaningful information through systematic methods. In geography, this process is vital for analyzing spatial patterns, demographic trends, environmental changes, and socio‑economic dynamics. The NCERT chapter emphasizes:
- Data Collection: Techniques like surveys, questionnaires, remote sensing, and secondary sources (government reports, census data).
- Data Classification: Organizing data into categories (e.g., qualitative vs. quantitative) for easier analysis.
- Tabulation and Graphical Representation: Using tables, graphs (bar, line, pie), and maps to visualize data effectively.
According to the Census of India 2021, over 1.38 billion records were processed, highlighting the scale at which Data Processing operates in real‑world governance. Students who grasp these fundamentals can tackle large datasets with confidence.
Step‑by‑Step Guide to Data Processing Techniques
1. Data Collection Methods
Effective Data Processing begins with reliable data collection. Primary methods include field surveys, interviews, and sensor‑based remote sensing. Secondary sources such as government publications, UNESCO reports, and the NCERT portal provide vetted datasets. For instance, rainfall data from the India Meteorological Department (IMD) can be downloaded and processed to study monsoon.
2. Data Classification and Organization
Once collected, data must be classified. Geographers often split data into qualitative (land‑use types, soil categories) and quantitative (population counts, temperature readings). Classification simplifies subsequent Data Processing steps and ensures that patterns are not obscured by noise.
3. Tabulation: Building Frequency Distribution Tables
A frequency distribution table organizes data into classes and shows how many observations fall into each class. For example, when analyzing literacy rates across Indian states, students might create intervals of 10% (0‑10%, 11‑20%, etc.) and count the number of states in each interval. This table is the foundation for further Data Processing such as calculating mean or drawing histograms.
4. Graphical Representation
Visual tools make Data Processing outcomes accessible. Common graphs include:
- Bar graphs – ideal for comparing discrete categories like crop production across states.
- Line graphs – perfect for showing trends over time, e.g., decadal population growth.
- Pie charts – useful for displaying proportional shares, such as land‑use distribution.
- Scatter plots – reveal correlations, e.g., between rainfall and yield.
Maps remain the most powerful geographic tool. Choropleth maps shade regions according to data values, while dot maps use symbols to represent quantities. Mastering these visualizations is a key outcome of the Data Processing chapter.
Practical Applications for Class 12 Students
The NCERT textbook provides hands‑on exercises that translate theory into practice:
- Create Frequency Distribution Tables for large datasets such as the literacy rates of all 28 Indian states.
- Interpret Histograms and Scatter Plots to identify correlations (e.g., rainfall patterns vs. crop yield in Punjab).
- Calculate Central Tendency (mean, median, mode) and dispersion (range, standard deviation) for datasets like urban population densities.
- Design Thematic Maps (choropleth, dot maps) using software tools like QGIS or manual plotting on graph sheets.
For example, students may analyze census data to map population density across Indian states, highlighting disparities and their geographical causes. Such exercises not only reinforce Data Processing skills but also prepare learners for field‑work based questions in competitive exams.
Why This Chapter Matters for Competitive Exams
CUET & UGC NET
Both exams frequently include data‑interpretation sets, graph‑reading questions, and map‑based problems. Proficiency in Data Processing enables candidates to quickly extract information from tables, compute percentages, and infer trends—skills that directly boost scores in the geography section.
UPSC
In the UPSC Geography optional paper and General Studies (GS‑I), case studies often require analysis of socio‑economic data, environmental statistics, or disaster‑management figures. A solid grounding in Data Processing allows aspirants to manipulate datasets, produce concise summaries, and answer with precision.
Practical Skills Edge
Beyond theory, examiners value the ability to plot graphs, label maps, and perform statistical calculations quickly. Mastery of tabulation, graph plotting, and tools like Excel or SPSS is therefore critical for scoring well in fieldwork‑oriented sections.
TheGeoecologist’s Approach to Teaching Data Processing
TheGeoecologist’s video tutorial bridges language barriers by explaining complex concepts in a mix of Hindi and English. Key highlights include:
- Step‑by‑Step Demos: How to convert raw data into frequency tables and graphical outputs using simple spreadsheet formulas.
- Real‑World Examples: Applications in disaster management (e.g., flood data analysis) and urban planning (e.g., traffic flow studies).
- Exam Tricks: Shortcuts for solving statistical problems quickly, such as using the assumed mean method for large datasets.
The video aligns with NCERT’s curriculum, making it a perfect supplement for visual learners who benefit from seeing Data Processing in action.
Pro Tips for Effective Learning
Practice Regularly
Solve NCERT exercises and previous years’ exam questions. Repetition builds speed and accuracy in Data Processing tasks.
Leverage Software
Tools like Excel, QGIS, or SPSS automate repetitive steps. Learning basic functions (e.g., AVERAGE, STDEV.P in Excel) saves time during exams.
Focus on Maps
Practice labeling and interpreting thematic maps (e.g., soil types, climate zones). Use outline maps of India and shade regions according to data classes—a skill often tested in map‑based questions.
Conclusion
Data Processing equips students with analytical skills crucial for geography enthusiasts and future researchers. Whether preparing for CBSE boards or UPSC, understanding this chapter ensures a strong grasp of spatial data interpretation. By mastering collection, classification, tabulation, and graphical representation, learners can transform raw numbers into insightful geographical narratives.
For in‑depth explanations, practical demonstrations, and exam‑oriented guidance, consider enrolling in TheGeoecologist’s paid courses at thegeoecologist.com. Stay connected via Instagram @thegeoecologist for updates and tips!
Frequently Asked Questions
Data Processing refers to the systematic collection, classification, tabulation, and graphical representation of raw geographical data to derive meaningful information for analysis and decision‑making.
It enables quick interpretation of tables, graphs, and maps, accurate calculation of statistical measures, and efficient solving of data‑based questions that frequently appear in CUET, UGC NET, and UPSC geography papers.
Excel for basic statistical calculations and graphing, QGIS for creating thematic maps, and SPSS for advanced statistical analysis are highly recommended for hands‑on practice.