Blog
World Resources Distribution: Complete UPSC Economic Geography Guide

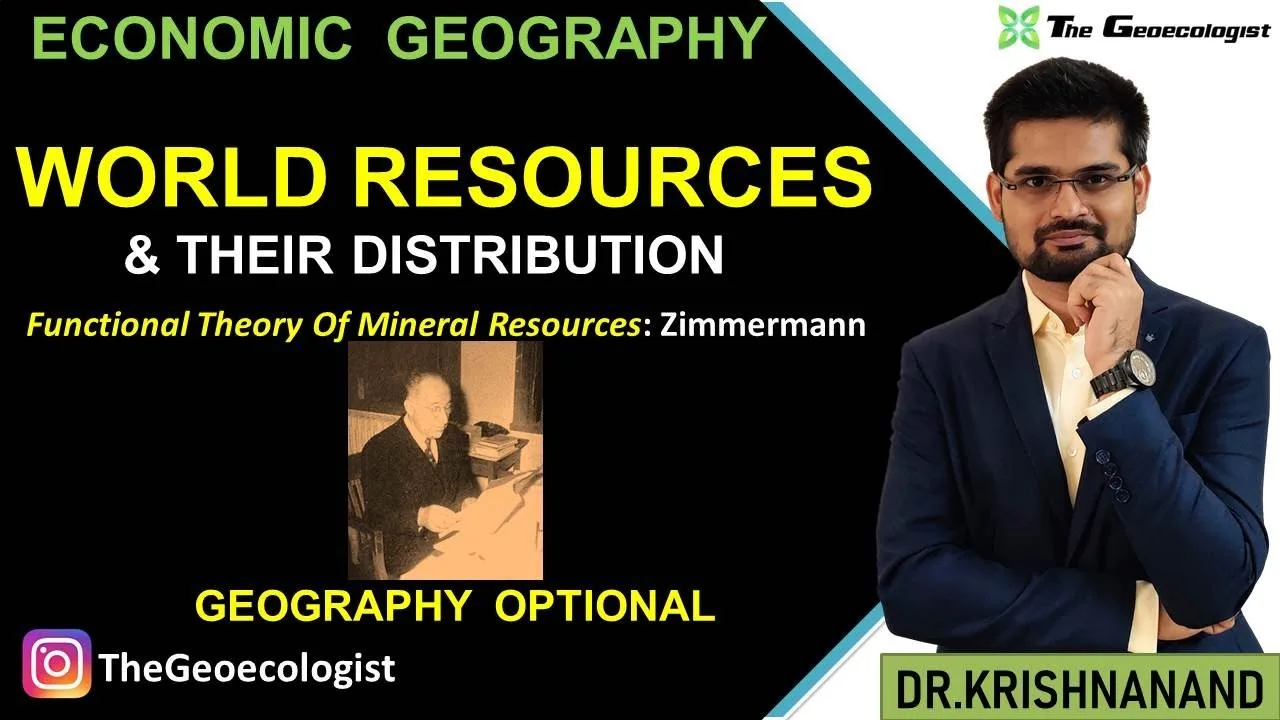
Table of Contents
- Why World Resources Distribution Matters for UPSC Preparation
- Core Conceptual Framework
- Major Resource Categories and Their Global Patterns
- Energy Resources: Fossil Fuels and Renewables
- Metallic Minerals: Ferrous, Non-Ferrous, and Critical
- Non-Metallic and Industrial Minerals
- Geopolitical Implications of Resource Geography
- Resource Diplomacy and Strategic Alliances
- The Resource Curse and Institutional Development
- India's Resource Security in Global Context
- Domestic Endowment and Import Dependence
- Policy Responses: PLI Schemes and Strategic Reserves
- Sustainable Resource Management: Emerging Paradigms
- Circular Economy and Urban Mining
- Deep Sea Mining and Space Resources
- Exam-Oriented Preparation Strategy
- Mapping Exercises for Spatial Mastery
- Current Affairs Integration
- Conclusion: From Examination to Governance
Understanding world resources distribution is fundamental for UPSC aspirants targeting Geography Optional and General Studies Paper 3. The uneven allocation of natural, mineral, and energy resources across continents shapes global trade, geopolitical alliances, and developmental trajectories. Dr. Krishnanand’s lecture on TheGeoecologist channel provides a structured framework to decode these patterns, making complex economic geography concepts accessible for examination success.
- Resource classification into renewable/non-renewable and biotic/abiotic categories forms the analytical foundation.
- Global concentration patterns explain why the Middle East holds 48% of proven oil reserves while the Democratic Republic of Congo produces 70% of global cobalt.
- Resource curse paradox illustrates how abundance can hinder institutional development in nations like Nigeria and Venezuela.
- Critical minerals geography now drives strategic competition, with China controlling 60% of rare earth processing capacity.
- Sustainable management frameworks like the EU’s Circular Economy Action Plan redefine resource governance for the 21st century.
Why World Resources Distribution Matters for UPSC Preparation
The UPSC syllabus explicitly covers world resources distribution across multiple papers. Geography Optional Paper 1 includes “Resources: Types, Distribution, and Utilization” while Paper 2 addresses “Mineral and Energy Resources” in the Indian context. General Studies Paper 3 examines “Infrastructure: Energy, Ports, Roads” and “Conservation, Environmental Pollution, and Degradation.” Mastery of world resources distribution enables aspirants to answer questions on resource diplomacy, trade wars, and climate justice with authoritative precision.
Core Conceptual Framework
Dr. Krishnanand structures the world resources distribution analysis around four pillars. First, geological determinism explains how plate tectonics and orogeny concentrate minerals — the Andes host porphyry copper deposits while the Bushveld Complex holds 75% of global platinum group metals. Second, climatic zoning governs agricultural and forest resources; the Ukrainian chernozem belt and American Midwest corn belt exemplify soil-climate synergy. Third, historical contingency shapes extraction infrastructure — colonial railways in Africa and Latin America were designed for resource export, not regional integration. Fourth, technological evolution redefines resource viability; hydraulic fracturing transformed US shale from uneconomic to the world’s largest oil producer by 2018.
Major Resource Categories and Their Global Patterns
Energy Resources: Fossil Fuels and Renewables
The distribution of world resources in energy reveals stark asymmetries. According to BP Statistical Review 2023, the Middle East holds 48.3% of proven oil reserves (836 billion barrels) while possessing only 6.1% of global population. Venezuela (303 billion barrels) and Saudi Arabia (267 billion barrels) lead national holdings. Natural gas follows similar concentration: Russia (37.4 trillion cubic meters), Iran (32.1 tcm), and Qatar (24.7 tcm) dominate. Coal distribution is more dispersed — USA (248 billion tonnes), Russia (162 Bt), Australia (150 Bt), China (143 Bt), and India (111 Bt) hold the largest reserves. – a key consideration for world resources distribution.
Renewable energy potential follows different geography. Solar irradiance peaks in the Sahara, Atacama, and Thar deserts. Wind corridors concentrate in Patagonia, the North Sea, and the US Great Plains. Hydropower potential aligns with major river basins — Congo, Amazon, Yangtze, and Brahmaputra. The International Renewable Energy Agency (IRENA) estimates that global renewable capacity reached 3,372 GW in 2023, with China contributing 1,450 GW (43%).
Metallic Minerals: Ferrous, Non-Ferrous, and Critical
Iron ore world resources distribution centers on four regions: Pilbara (Australia), Carajás (Brazil), Mesabi Range (USA), and Krivoy Rog (Ukraine). Australia and Brazil together export 85% of seaborne iron ore. Copper concentrates in Chile (28% of global production), Peru (12%), and the DRC (10%). The “Lithium Triangle” — Bolivia, Argentina, Chile — holds 56% of identified lithium resources (89 million tonnes per USGS 2024). Rare earth elements show extreme concentration: China (44 million tonnes reserves), Vietnam (22 Mt), Brazil (21 Mt), and Russia (10 Mt). However, processing dominance exceeds mining share — China processes 90% of heavy rare earths.
India’s critical mineral strategy, formalized through the 2023 amendment to the Mines and Minerals (Development and Regulation) Act, targets 30 minerals including lithium, cobalt, nickel, and rare earths. The UPSC syllabus increasingly references such policy developments in mains questions.
Non-Metallic and Industrial Minerals
Phosphate rock reserves concentrate in Morocco/Western Sahara (50 billion tonnes, 70% global), China (3.2 Bt), Egypt (2.8 Bt), and Algeria (2.2 Bt). Potash deposits cluster in Canada (1.1 Bt), Russia (600 Mt), Belarus (500 Mt), and China (210 Mt). These fertilizers underpin global food security — a critical linkage for GS Paper 3 agriculture questions. Diamond production shifted from South Africa to Botswana (24 million carats), Russia (22 Mc), Canada (16 Mc), and DRC (12 Mc) by 2023.
Geopolitical Implications of Resource Geography
Resource Diplomacy and Strategic Alliances
The world resources distribution map directly shapes foreign policy. The 1973 oil embargo demonstrated how resource concentration translates to political leverage. Contemporary examples include China’s Belt and Road Initiative securing mineral access across Africa and Latin America, and the US-EU Critical Minerals Partnership countering supply chain vulnerabilities. India’s KABIL (Khanij Bidesh India Ltd.) joint venture targets lithium and cobalt assets in Argentina and Australia.
The Resource Curse and Institutional Development
Economists Sachs and Warner (1995) documented the inverse relationship between resource abundance and economic growth. Nigeria’s oil wealth (90% of export earnings) coexists with 40% poverty rates. Venezuela’s oil rents funded consumption over diversification, precipitating collapse post-2014. Botswana defies the curse through diamond revenue management — the Pula Fund and transparent institutions yielded upper-middle-income status. The IMF’s 2023 analysis confirms that resource distribution outcomes depend on institutional quality, not geology alone.
India’s Resource Security in Global Context
Domestic Endowment and Import Dependence
India’s world resources distribution position reveals strategic vulnerabilities. Despite holding the world’s 4th largest coal reserves (344 Bt), thermal coal imports reached 162 million tonnes in FY2023-24. Oil import dependence exceeds 87% (232 million tonnes crude imported). Natural gas imports (LNG) meet 50% of consumption. Critical minerals show near-total import reliance — 100% for lithium, cobalt, nickel; 95% for copper concentrate.
Policy Responses: PLI Schemes and Strategic Reserves
The Production Linked Incentive (PLI) schemes for Advanced Chemistry Cell (ACC) batteries (₹18,100 crore) and specialty steel (₹6,322 crore) target domestic value addition. The Strategic Petroleum Reserve (SPR) at Visakhapatnam, Mangalore, and Padur holds 5.33 million tonnes (9.5 days of consumption). The 2024 budget announced a Critical Mineral Mission with ₹16,300 crore outlay for exploration, recycling, and overseas acquisition.
Sustainable Resource Management: Emerging Paradigms
Circular Economy and Urban Mining
The EU’s Circular Economy Action Plan (2020) mandates recycled content targets — 16% cobalt, 6% lithium, 6% nickel by 2031. Japan’s “urban mining” recovers 16% of global gold reserves from e-waste. India’s E-Waste (Management) Rules 2022 introduced Extended Producer Responsibility (EPR) certificates, targeting 60% collection by 2028. These frameworks redefine world resources distribution by treating waste as distributed secondary deposits.
Deep Sea Mining and Space Resources
The Clarion-Clipperton Zone (Pacific) contains 21 billion tonnes of polymetallic nodules — more nickel, cobalt, and manganese than land reserves. The International Seabed Authority (ISA) debates exploitation codes; India holds exploration rights for 75,000 sq km. Asteroid 16 Psyche’s metallic core (iron-nickel worth ~$10 quintillion) represents the ultimate resource distribution frontier, though extraction remains speculative.
Exam-Oriented Preparation Strategy
Mapping Exercises for Spatial Mastery
Aspirants should practice drawing world resources distribution maps from memory: (1) Oil/Gas — Persian Gulf, Caspian, West Siberia, Gulf of Mexico, North Sea. (2) Iron Ore — Pilbara, Carajás, Hamersley, Mesabi, Krivoy Rog, Anshan. (3) Critical Minerals — Lithium Triangle, Cobalt Belt (DRC-Zambia), Rare Earth Arc (China-Myanmar). (4) Agricultural — Chernozem, Prairie, Pampas, Indo-Gangetic, Nile Delta. Annotate with production percentages and export flows.
Current Affairs Integration
Link static geography to dynamic developments: (a) Indonesia’s nickel export ban (2020) and downstreaming policy. (b) Chile’s lithium nationalization strategy (2023). (c) US Inflation Reduction Act (2022) critical mineral sourcing requirements. (d) India-Australia Economic Cooperation Trade Agreement (2022) for critical minerals. (e) COP28 UAE Consensus (2023) on transitioning from fossil fuels.
Conclusion: From Examination to Governance
Mastering world resources distribution transcends UPSC clearance — world resources distribution equips future administrators to negotiate resource contracts, design mineral security strategies, and balance development with ecological limits. Dr. Krishnanand’s lecture, supplemented by the Simplified Economic Geography eBook, provides the conceptual toolkit. Combine video learning with map practice, current affairs linkage, and answer writing. TheGeoecologist community offers sustained engagement through membership perks and live sessions. In an era where critical minerals determine technological sovereignty and climate action reshapes energy geography, this knowledge constitutes strategic capital for India’s administrative leadership.
Next Steps: Watch the full lecture on TheGeoecologist YouTube channel, download the eBook from geographyebooks.com, and join the Telegram channel for daily map-based quizzes. Your economic geography mastery begins now.
Frequently Asked Questions
UPSC Economic Geography covers four major resource categories: energy resources (oil, gas, coal, renewables), metallic minerals (ferrous like iron ore, non-ferrous like copper, critical minerals like lithium and rare earths), non-metallic minerals (phosphate, potash, diamonds), and agricultural/forest resources governed by soil-climate zones.
India faces high import dependence — 87% for oil, 50% for natural gas, 100% for lithium and cobalt. The government responds through PLI schemes for battery manufacturing, Strategic Petroleum Reserves, KABIL for overseas mineral acquisition, and the 2024 Critical Mineral Mission with ₹16,300 crore outlay for domestic exploration and recycling.
The resource curse describes how abundant natural resources correlate with poor economic growth and weak institutions. Nigeria (oil), Venezuela (oil), and DRC (cobalt) exemplify the curse, while Botswana (diamonds) and Norway (oil) demonstrate successful avoidance through transparent governance and sovereign wealth funds.