Blog
NASA Atmospheric Aerosols: Tiny Particles Travel Thousands of Miles Globally

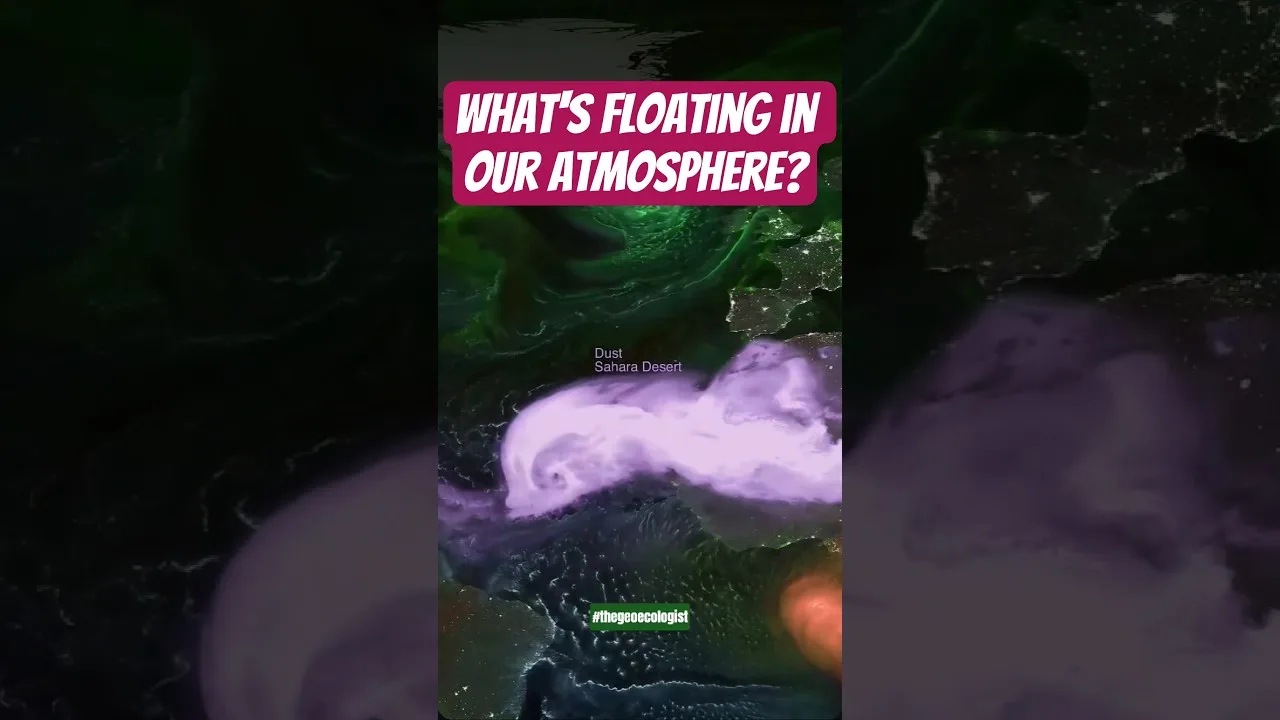
Table of Contents
- What Are Atmospheric Aerosols and Why Do They Matter?
- Major Aerosol Types Tracked by NASA
- How NASA Visualizes Global Aerosol Transport
- Key Features of the GEOS Aerosol Model
- Transcontinental Aerosol Transport: Case Studies
- Saharan Dust to the Americas
- Asian Pollution to North America
- Boreal Fire Smoke Circumnavigation
- Health and Environmental Impacts of Long-Range Transport
- Climate Forcing and Feedback Mechanisms
- Operational Applications: From Forecasting to Policy
- Data Access and Visualization Tools
- Future Directions in Aerosol Remote Sensing
- Conclusion: A Global Perspective on Invisible Threats
NASA atmospheric aerosols visualization reveals how microscopic particles like dust, smoke, sea salt, and sulfates traverse thousands of miles across Earth’s atmosphere, influencing air quality and climate patterns far from their origins. This groundbreaking data visualization from NASA’s Goddard Earth Observing System (GEOS) provides scientists and the public with an unprecedented view of the invisible rivers of particulate matter that circulate our planet daily. Understanding these aerosol movements is critical for predicting air quality events, modeling climate change, and protecting public health on a global scale.
- NASA atmospheric aerosols include dust, smoke, sea salt, and sulfate particles that travel thousands of miles across continents and oceans.
- The GEOS model visualization tracks aerosol transport in near real-time, revealing global circulation patterns.
- These particles significantly impact air quality, visibility, cloud formation, and Earth’s radiation budget.
- Long-range transport means pollution from one continent affects air quality on another.
- NASA’s data helps forecasters predict hazardous air quality events days in advance.
What Are Atmospheric Aerosols and Why Do They Matter?
Atmospheric aerosols are solid or liquid particles suspended in the air, ranging from a few nanometers to tens of micrometers in diameter. Unlike greenhouse gases, which are molecular, these particles have physical surfaces that interact with sunlight, clouds, and human respiratory systems. NASA atmospheric aerosols research categorizes them into several major types: mineral dust lifted from deserts, black carbon and organic carbon from wildfires and combustion, sea salt ejected from ocean waves, and sulfate aerosols formed from volcanic emissions and industrial sulfur dioxide.
The significance of these particles extends far beyond their size. According to the Intergovernmental Panel on Climate Change (IPCC), aerosols represent one of the largest uncertainties in climate modeling. They can both cool the planet by reflecting sunlight and warm NASA atmospheric aerosols by absorbing radiation, depending on their composition, altitude, and geographic location. The NASA atmospheric aerosols visualization makes these complex interactions visible and tractable for researchers worldwide.
Major Aerosol Types Tracked by NASA
The NASA visualization distinguishes between four primary aerosol categories, each with distinct sources, optical properties, and atmospheric lifetimes:
- Mineral Dust: Originating primarily from the Sahara Desert, the Gobi Desert, and the Arabian Peninsula, dust particles can reach altitudes of 5-6 kilometers and cross entire ocean basins. The Sahara alone exports approximately 182 million tons of dust annually, with roughly 27 million tons reaching the Amazon Basin, delivering essential phosphorus nutrients.
- Biomass Burning Smoke: Wildfires in boreal forests, tropical savannas, and agricultural regions inject massive quantities of black carbon and organic aerosols into the upper troposphere. The 2019-2020 Australian bushfires injected nearly 1 million metric tons of smoke into the stratosphere, where NASA atmospheric aerosols persisted for months and circled the globe.
- Sea Salt: Generated by wind-driven wave breaking and bubble bursting at the ocean surface, sea salt aerosols dominate the marine boundary layer. They serve as cloud condensation nuclei, influencing marine cloud brightness and precipitation efficiency.
- Sulfate Aerosols: Formed from the oxidation of sulfur dioxide (SO₂) from volcanic eruptions, industrial emissions, and marine phytoplankton. The 1991 Mount Pinatubo eruption injected 20 million tons of SO₂ into the stratosphere, forming a global sulfate veil that cooled Earth’s surface by approximately 0.5°C for two years.
How NASA Visualizes Global Aerosol Transport
The NASA atmospheric aerosols visualization leverages the Goddard Earth Observing System (GEOS) model, which assimilates satellite observations from multiple instruments including the Moderate Resolution Imaging Spectroradiometer (MODIS) on Terra and Aqua satellites, the Visible Infrared Imaging Radiometer Suite (VIIRS) on Suomi-NPP and NOAA-20, and the Cloud-Aerosol Lidar with Orthogonal Polarization (CALIOP) on the CALIPSO satellite. This data assimilation system produces a consistent, gridded, three-dimensional representation of aerosol distributions every six hours.
The visualization technique assigns distinct colors to each aerosol type: orange for dust, red for black carbon smoke, blue for sea salt, and white for sulfates. This color-coding allows viewers to instantly identify source regions and track plumes as they evolve. The model incorporates emission inventories, meteorological fields, chemical transformation schemes, and deposition processes (both dry and wet) to simulate the complete aerosol lifecycle from emission to removal.</p
Key Features of the GEOS Aerosol Model
- Horizontal Resolution: Approximately 12.5 km (0.125°) globally, with nested higher-resolution domains for regional studies.
- Vertical Layers: 72 hybrid sigma-pressure levels extending from surface to 0.01 hPa (~80 km altitude).
- Assimilation Cycle: 6-hourly analysis updates using satellite aerosol optical depth (AOD) retrievals.
- Chemical Mechanisms: Includes gas-phase chemistry, aqueous-phase sulfate production, and aerosol microphysics (nucleation, condensation, coagulation).
Transcontinental Aerosol Transport: Case Studies

The NASA atmospheric aerosols visualization dramatically illustrates how particle pollution knows no borders. Several well-documented transport events demonstrate the global interconnectedness of Earth’s atmosphere:
Saharan Dust to the Americas
Each year, particularly during boreal summer, the Saharan Air Layer (SAL) carries massive dust loads westward across the Atlantic. NASA’s CALIPSO lidar measurements show that approximately 182 million tons of dust leave North Africa annually, with 27.7 million tons (15%) depositing in the Amazon Basin and 43 million tons settling over the Caribbean Sea. This dust delivers an estimated 22,000 tons of phosphorus annually to Amazon soils, effectively fertilizing the rainforest. However, the same dust degrades air quality in Puerto Rico, Florida, and Texas, frequently pushing PM₂.₅ concentrations above EPA standards.
Asian Pollution to North America
Springtime westerly winds transport Asian industrial pollution and dust across the Pacific. Research published in Atmospheric Chemistry and Physics estimates that 12-15% of surface sulfate concentrations in the western United States originate from Asian emissions. During strong transport events, Asian dust contributes 20-50% of PM₁₀ at high-elevation sites like Mount Bachelor Observatory in Oregon. The NASA atmospheric aerosols model captures these episodes, showing distinct plumes emanating from the Taklamakan and Gobi deserts and the industrial corridors of eastern China.
Boreal Fire Smoke Circumnavigation
The 2023 Canadian wildfire season produced record-breaking emissions, with over 18 million hectares burned. NASA’s GEOS model tracked smoke plumes that reached Europe within 4-5 days and completed full circumnavigation of the Northern Hemisphere within two weeks. Surface monitors in Norway, Sweden, and the UK detected elevated PM₂.₅ concentrations directly attributable to North American fires. This demonstrates how NASA atmospheric aerosols data provides early warning for downwind populations thousands of kilometers from fire sources.
Health and Environmental Impacts of Long-Range Transport
The health implications of long-range aerosol transport are profound. The World Health Organization estimates that ambient air pollution causes 4.2 million premature deaths annually, with a significant fraction attributable to particles transported from distant sources. Fine particulate matter (PM₂.₅) penetrates deep into the lungs and enters the bloodstream, contributing to cardiovascular disease, respiratory illness, and cognitive decline. NASA atmospheric aerosols data enables epidemiologists to distinguish local from transported pollution, improving exposure assessments for health studies.
Beyond direct health effects, aerosols modify cloud properties and precipitation patterns. The “aerosol indirect effect” describes how increased aerosol concentrations create more numerous but smaller cloud droplets, suppressing precipitation and increasing cloud albedo. This effect is particularly pronounced in marine stratocumulus regions off the coasts of California, Peru, and Namibia, where ship tracks — visible lines of brightened clouds formed on ship exhaust — provide a natural laboratory for studying aerosol-cloud interactions. The NASA atmospheric aerosols visualization reveals these ship tracks as fine blue lines threading through marine cloud decks.
Climate Forcing and Feedback Mechanisms
Aerosols exert a net cooling effect on climate, offsetting approximately 30-50% of greenhouse gas warming according to IPCC AR6. However, this cooling is spatially heterogeneous and temporally variable. Black carbon on snow and ice reduces surface albedo, accelerating Arctic melting — a positive feedback loop. The NASA atmospheric aerosols model tracks black carbon deposition in the Arctic, showing peak concentrations in spring from Eurasian agricultural burning and wildfires. This “Arctic haze” phenomenon, first identified in the 1950s, remains a critical research focus for understanding polar amplification.
Operational Applications: From Forecasting to Policy
NASA atmospheric aerosols data products serve operational needs beyond scientific research. The NASA Global Modeling and Assimilation Office (GMAO) provides near-real-time aerosol forecasts to air quality agencies worldwide. The U.S. National Weather Service incorporates GEOS aerosol optical depth into its experimental air quality forecast guidance. European Centre for Medium-Range Weather Forecasts (ECMWF) assimilates NASA satellite retrievals into its Copernicus Atmosphere Monitoring Service (CAMS), which delivers daily air quality forecasts for Europe and global boundary conditions for regional models.
Policy applications include verifying emission reduction commitments under international agreements. The Convention on Long-Range Transboundary Air Pollution (CLRTAP) uses satellite-derived aerosol trends to assess progress on sulfur and nitrogen oxide protocols. NASA atmospheric aerosols observations provided critical evidence for the 2012 Gothenburg Protocol amendments, demonstrating declining sulfate aerosols over Europe and North America but increasing trends over East Asia prior to China’s aggressive air pollution control actions starting in 2013.
Data Access and Visualization Tools
NASA makes atmospheric aerosols data freely available through multiple portals:
- NASA Worldview: Interactive browser-based visualization of near-real-time satellite imagery and model outputs (worldview.earthdata.nasa.gov).
- GES DISC: Goddard Earth Sciences Data and Information Services Center archives GEOS model outputs and satellite retrievals.
- Giovanni: Web-based analysis tool for subsetting, visualizing, and downloading aerosol data without specialized software.
- OpenAQ: Aggregates surface monitor data globally, enabling validation of NASA atmospheric aerosols model predictions against ground truth.
Future Directions in Aerosol Remote Sensing
The next decade promises transformative advances in NASA atmospheric aerosols observation capabilities. The Plankton, Aerosol, Cloud, ocean Ecosystem (PACE) mission, launched in February 2024, carries the Ocean Color Instrument (OCI) and two multi-angle polarimeters (SPEXone and HARP2) that will retrieve aerosol microphysical properties (size distribution, refractive index, shape) with unprecedented accuracy. The Multi-Angle Imager for Aerosols (MAIA) investigation, targeting launch in 2026, will specifically characterize particulate matter toxicity by linking aerosol speciation to health outcomes in major metropolitan areas.
Meanwhile, the Geostationary Extended Observations (GeoXO) constellation will provide hourly aerosol monitoring over the Western Hemisphere from geostationary orbit, capturing diurnal cycles of fire emissions, dust uplift, and urban pollution that polar orbiters miss. These observations will feed into next-generation data assimilation systems, improving NASA atmospheric aerosols forecasts from days to weeks and enabling sub-seasonal air quality prediction — a capability urgently needed as climate change increases the frequency and intensity of wildfire and dust events.
Conclusion: A Global Perspective on Invisible Threats
The NASA atmospheric aerosols visualization transforms abstract data into a visceral understanding of our shared atmosphere. When we watch Saharan dust fertilize the Amazon, Canadian smoke darken European skies, or Asian pollution reach American shores, we witness the physical reality of planetary interconnectedness. This perspective is essential for crafting effective environmental policies, protecting vulnerable populations, and advancing climate science. As satellite technology and modeling capabilities continue to evolve, NASA’s commitment to open data ensures that researchers, policymakers, and citizens worldwide can access the tools needed to breathe easier in a changing world.
The story of NASA atmospheric aerosols is ultimately a story about borders that don’t exist in nature. Particles emitted in one nation become the air quality crisis of another; smoke from a boreal forest fire becomes the stratospheric aerosol layer that cools the planet; dust from an ancient desert becomes the fertilizer for a living rainforest. Understanding these connections is not merely scientific curiosity — it is a prerequisite for survival on our shared, finite planet.
Frequently Asked Questions
NASA tracks four primary aerosol types: mineral dust from deserts, black carbon smoke from wildfires and combustion, sea salt from ocean spray, and sulfate aerosols from volcanic and industrial emissions.
Atmospheric aerosols can travel thousands of miles. Saharan dust regularly crosses the Atlantic to the Americas, Asian pollution reaches North America, and wildfire smoke can circumnavigate the globe within weeks.
NASA uses the GEOS model, which assimilates satellite data from MODIS, VIIRS, and CALIPSO instruments to create 3D, color-coded visualizations of global aerosol distributions updated every six hours.