Blog
El Niño phenomenon: The Ocean That Changes the World

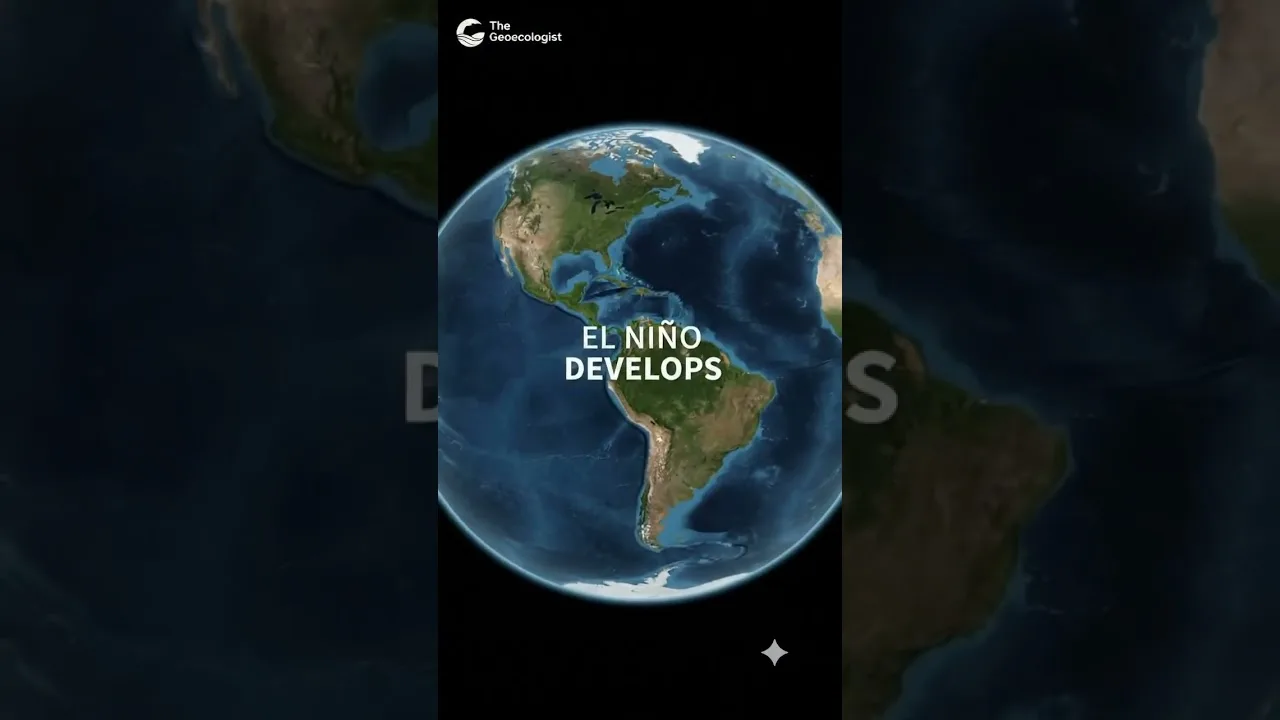
Table of Contents
El Niño phenomenon is a climate pattern characterized by unusually warm sea surface temperatures in the central and eastern tropical Pacific Ocean. This warming disrupts normal trade winds and can lead to significant shifts in global weather patterns. In this article we explore the mechanics, historical events, worldwide impacts, and future outlook of the El Niño phenomenon.
- El Niño phenomenon arises from weakened trade winds that allow warm water to accumulate eastward.
- Strong El Niño events can raise global average temperatures by 0.2‑0.4 °C.
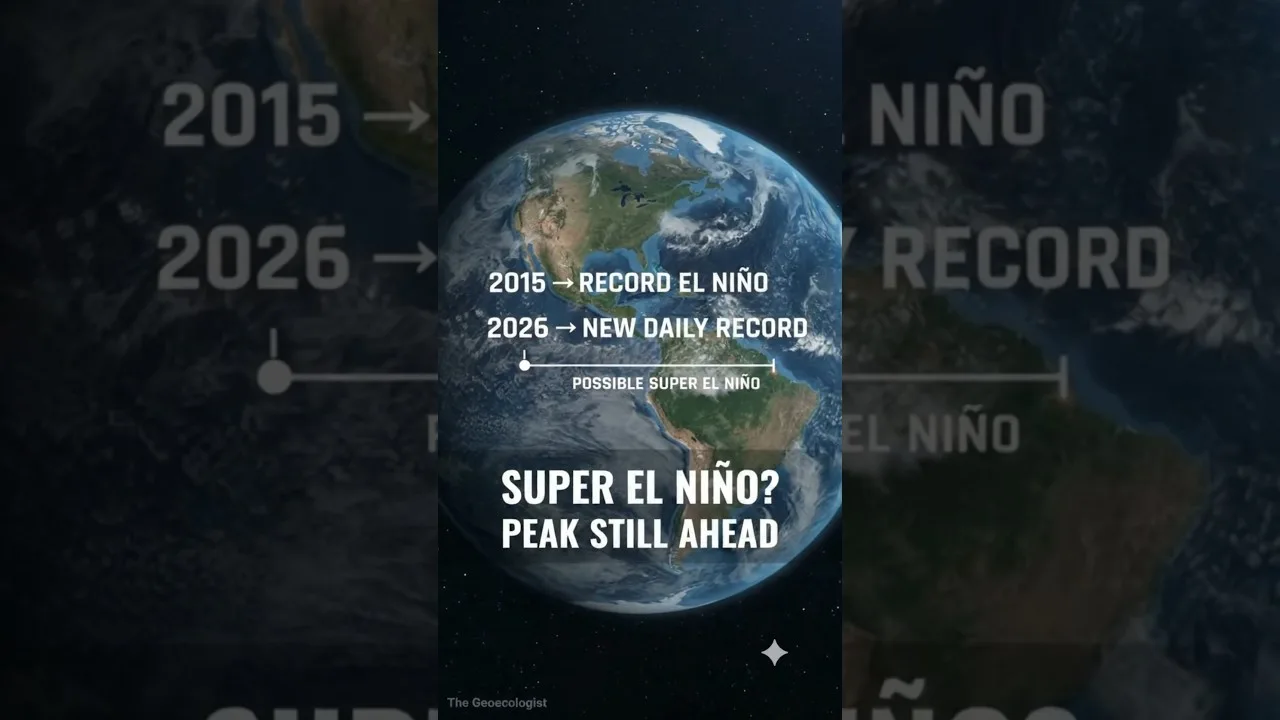
- Historical super El Niños (1982‑83, 1997‑98, 2015‑16) caused billions in damages.
- Understanding the El Niño phenomenon helps improve seasonal forecasts for agriculture and disaster preparedness.
Understanding the El Niño phenomenon
Scientists monitor the El Niño phenomenon using satellite buoys, Argo floats, and the Tropical Atmosphere Ocean (TAO) array. The process begins when the prevailing easterly trade winds weaken or reverse, reducing the upwelling of cold water along the South American coast. As a result, warm surface water that normally piles up in the western Pacific sloshes eastward, raising sea‑surface temperatures (SSTs) by 1‑3 °C across the central and eastern basins. This thermal anomaly alters atmospheric convection, shifting the Pacific jet stream and influencing weather far beyond the tropics.
The Science Behind Warm Waters
During an El Niño phenomenon, the thermocline deepens in the east and shoals in the west, suppressing nutrient‑rich upwelling. Satellite observations from NASA’s MODIS show chlorophyll concentrations dropping by up to 40 % in the eastern Pacific, affecting fisheries. The ocean‑atmosphere coupling is quantified by the Niño 3.4 index; values exceeding +0.5 °C for five consecutive overlapping three‑month periods define an El Niño episode.
Historical Events: 1997‑98 Super El Niño
The 1997‑98 El Niño phenomenon remains one of the strongest on record, with peak Niño 3.4 SST anomalies reaching +2.4 °C. According to NOAA, this event contributed to a global temperature spike of ~0.2 °C above the 1981‑2010 average, triggered devastating floods in Peru and Kenya, and caused severe droughts in Indonesia and Australia, leading to widespread forest fires. Economic losses were estimated at US$35‑45 billion worldwide.
How El Niño Influences Global Weather

The El Niño phenomenon reorganizes planetary waveguides, altering the position and intensity of the subtropical jet stream. In North America, winters tend to be warmer and wetter across the southern United States, while the Pacific Northwest experiences drier conditions. South America sees enhanced rainfall along the equatorial Andes and reduced precipitation in the northeastern Brazil. In East Asia, the summer monsoon can be weakened, leading to heatwaves in Japan and Korea.
Impacts on Agriculture and Economy
Agricultural yields are highly sensitive to the El Niño phenomenon. The USDA reports that corn production in the U.S. Midwest can decline by 5‑10 % during strong El Niño years due to excess moisture and delayed planting. Conversely, soybean yields in Argentina often increase by 3‑7 % because of favorable rainfall. The World Bank estimates that a major El Niño can reduce global GDP by 0.3‑0.5 % through disruptions to energy, transport, and insurance sectors.
Extreme Weather Events
Extreme weather linked to the El Niño phenomenon includes heightened tropical cyclone activity in the central Pacific and suppressed activity in the Atlantic basin. The 2015‑16 El Niño contributed to the record‑breaking Hurricane Patricia, which reached peak winds of 345 km/h, the strongest ever measured in the Western Hemisphere. In contrast, the Atlantic saw only 11 named storms that season, below the 30‑year average of 12.
Future Projections and Climate Change
Climate models from the IPCC Sixth Assessment Report suggest that while the frequency of El Niño events may not change dramatically, the intensity of the strongest episodes could increase due to background ocean warming. A warmer mean state raises the baseline SSTs, meaning that a given anomalous heat content produces larger relative temperature spikes. Some studies project a 10‑20 % increase in the likelihood of super El Niño occurrences by 2050 under high‑emission scenarios.
Monitoring and Prediction
Improved forecasting relies on coupled ocean‑atmosphere models such as the CFSv2 and ECMWF SEAS5. These systems assimilate real‑time data from the TAO array, satellite altimetry, and Argo floats to predict the El Niño phenomenon up to six months in advance. Skill scores have risen from ~0.4 in the early 2000s to over 0.6 today, enabling better preparedness for disaster management agencies.
In summary, the El Niño phenomenon remains a pivotal driver of global climate variability. By understanding its mechanisms, tracking its evolution, and anticipating its impacts, societies can mitigate risks and harness opportunities linked to this powerful ocean‑atmosphere interaction.
Frequently Asked Questions
The El Niño phenomenon is triggered by a weakening or reversal of the easterly trade winds across the tropical Pacific, which allows warm surface water to flow eastward and raises sea‑surface temperatures in the central and eastern basins.
Strong El Niño events typically occur every 2‑7 years, with super El Niño episodes like those in 1982‑83, 1997‑98, and 2015‑16 being rarer, averaging roughly once every 15‑20 years.
Yes, modern coupled ocean‑atmosphere models can forecast the El Niño phenomenon up to six months ahead with improving accuracy, using data from buoys, satellites, and ocean temperature arrays.