Blog
Data tabulation geography: Mastering Field Work and Report Writing for UPSC Aspirants


Many geography students struggle with data tabulation geography and presenting their field observations clearly, which hampers their performance in UPSC CSE and undergraduate exams.
- Learn why accurate data tabulation is the backbone of credible geographic analysis.
- Discover simple graphical techniques that turn raw numbers into compelling visuals.
- See how the Field Work And Report Writing e-book aligns with the CBCS syllabus and exam expectations.
- Get practical steps to apply these skills in your next field report or assignment.
- Understand what to look for when choosing a study guide for data handling in geography.
Understanding the Challenge: Data Tabulation and Graphical Representation in Geography
When learners first encounter fieldwork, they often collect pages of raw observations but feel stuck when it comes to organizing those numbers into tables. Effective data tabulation geography requires more than just listing values; it demands a clear structure that highlights patterns, facilitates comparison, and supports statistical analysis. Without a solid tabulation foundation, any subsequent graph or map risks being misleading or incomplete. Many aspirants lose marks because their tables lack proper headings, units, or consistent formatting, making it difficult for examiners to follow their reasoning. This challenge is amplified in competitive exams like UPSC CSE, where precision and clarity directly impact scores. Recognizing this gap early helps students allocate time to mastering tabulation before moving on to visualization.
Core Concepts of Data Tabulation in Geographic Research

At its heart, data tabulation involves arranging collected information into rows and columns where each column represents a variable and each row a specific observation. For geographic studies, common variables include location coordinates, altitude, soil pH, rainfall intensity, and socio‑economic indicators. A well‑designed table includes a descriptive title, clear column headings with units, and a legend if symbols or abbreviations are used. Consistency is vital: using the same number of decimal places, aligning numbers to the right, and grouping similar data improves readability. Students should also learn to create subsidiary tables that break down complex datasets—for example, separating urban and rural samples within a larger survey. The data tabulation geography process also involves checking for missing values, outliers, and errors before finalizing the table, ensuring that the subsequent analysis rests on reliable data.
Effective Techniques for Graphical Representation
Once data is neatly tabulated, the next step is to choose the right graphical form to convey the story behind the numbers. For geographic data, common choices include bar charts for categorical comparisons, line graphs for trends over time or distance, scatter plots to explore relationships between two continuous variables, and choropleth maps to show spatial variation. Each graph type follows specific conventions: axes must be labeled with variables and units, scales should start at zero unless a justified break is needed, and legends must explain any colour or symbol coding. Good practice also involves keeping the design simple—avoiding 3‑D effects, excessive gridlines, or decorative fonts that distract from the data. When students master both tabulation and graphing, they can produce field reports that are not only academically rigorous but also visually engaging, a quality that examiners consistently reward.
How Field Work And Report Writing E-Book Addresses These Needs
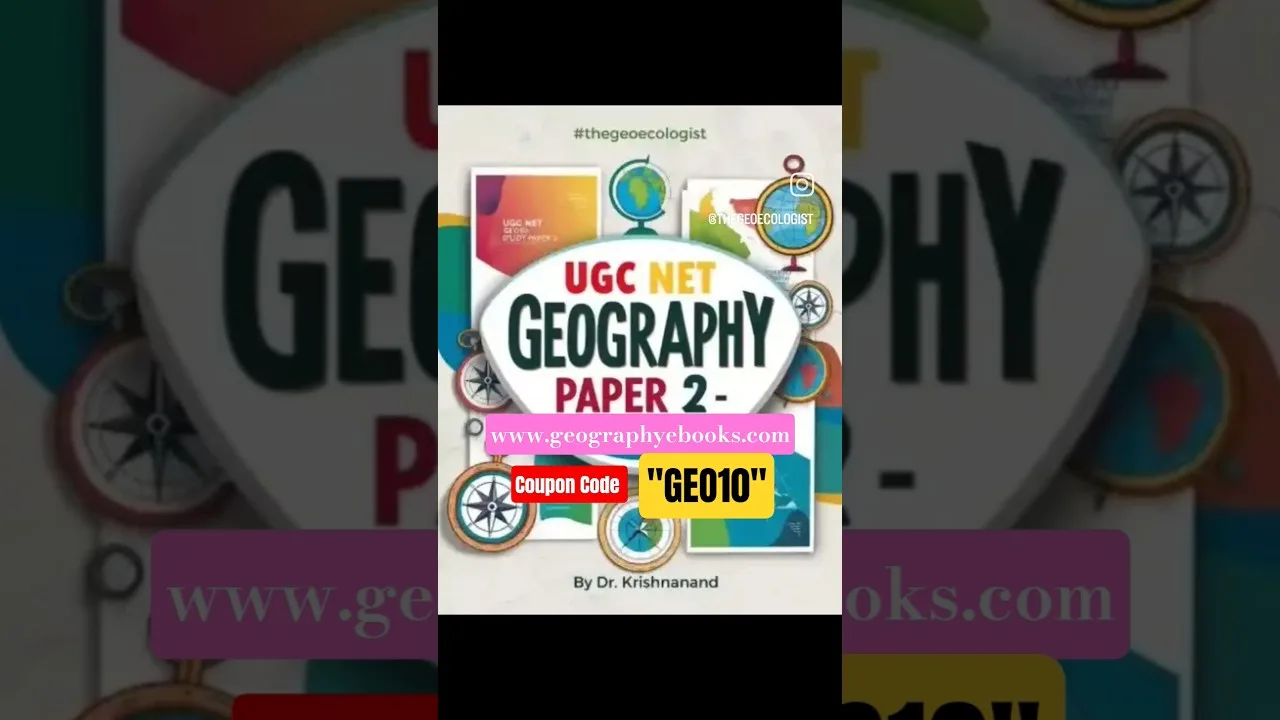
The Field Work And Report Writing e-book by Dr. Krishnanand directly tackles the pain points associated with data tabulation geography and visual communication. Aligned with the prescribed CBCS syllabus, the book breaks down each stage of fieldwork into point‑wise highlighted sections, supported by diagrams, maps, and images that illustrate how to build tables and choose appropriate graphs. Chapter 6, “Database in Geographical Research,” walks readers through creating structured datasets, while Chapter 7, “Methods of Data Collection,” explains how to record observations in a tabular‑friendly format. Later chapters guide learners through presenting findings with clarity, ensuring that the final report flows logically from raw data to insightful interpretation. Because the content is concise yet comprehensive, students can quickly locate the exact guidance they need for assignments or exam preparation, making the e-book a practical companion for mastering these essential skills.
Practical Steps to Apply These Skills in Your Studies
To translate theory into action, start by reviewing your latest field notebook and identifying three datasets that could benefit from tabulation. Create a simple spreadsheet or use graph paper to arrange the data, applying the principles of clear headings, units, and consistent formatting discussed earlier. Next, experiment with two different graph types—for instance, a bar chart to compare soil pH across sites and a line graph to show temperature changes over a day. Compare which visualization best highlights the trend you wish to emphasize. Then, consult the Field Work And Report Writing e-book to verify that your table and graph meet the standards outlined in Chapters 6 and 8. Finally, draft a short report section that integrates the table, graph, and a brief interpretation, focusing on clarity and logical flow. Repeating this cycle with new fieldwork will build confidence and improve your scores in both internal assessments and competitive exams like UPSC CSE.
Buying Guide: Choosing the Right Study Material for UPSC and Undergrad Geography
When selecting a resource to strengthen data tabulation geography skills, consider three key factors: syllabus alignment, pedagogical clarity, and visual support. The ideal guide should explicitly reference the CBCS geography curriculum, ensuring that the topics covered match what examiners expect. Look for materials that use a point‑wise format with highlighted key points, as this aids quick revision and retention. Visual elements such as diagrams, maps, and sample tables are crucial because they demonstrate the application of concepts in a concrete way. The Field Work And Report Writing e-book satisfies all these criteria: it is designed for the CBCS syllabus, presents information in digestible highlighted points, and includes numerous diagrams and maps that illustrate tabulation and graphing techniques. Additionally, the author’s expertise in geography and experience with UPSC aspirants adds credibility. By choosing a resource that meets these benchmarks, students invest in a tool that not only clarifies difficult concepts but also saves preparation time.
Frequently Asked Questions
What is the importance of data tabulation geography in field reports? Accurate tabulation organizes raw observations, making patterns visible and providing a reliable base for analysis and graphing.
How does the Field Work And Report Writing e-book help with graphical representation? It offers step‑by‑step guidance on selecting appropriate graph types, labeling axes, and creating legends, supported by visual examples.
Is this e-book suitable for undergraduate geography courses? Yes, it follows the CBCS syllabus used in many undergraduate programs and clarifies concepts needed for coursework and exams.
Further reading: Data tabulation geography on Wikipedia
Our Recommendation
📖 Part of our complete guide: Evolution of Geographical Thought: A Comprehensive Guide for UPSC Aspirants and Geography Enthusiasts
Frequently Asked Questions
Why is data tabulation geography critical for UPSC CSE preparation?
It structures field data for clear analysis, which is essential for scoring well in geography papers where precision and presentation are evaluated.
Can I use the Field Work And Report Writing e-book for practical assignments in college?
Absolutely, the book’s methods align with the CBCS undergraduate geography curriculum and help students create accurate tables and graphs for assignments.
What graphical techniques are covered in the Field Work And Report Writing e-book?
The e‑book explains bar charts, line graphs, scatter plots, and choropleth maps, with step‑by‑step instructions on axis labeling, scaling, and legend creation.