Blog
Population Distribution India: Density, Growth & Composition

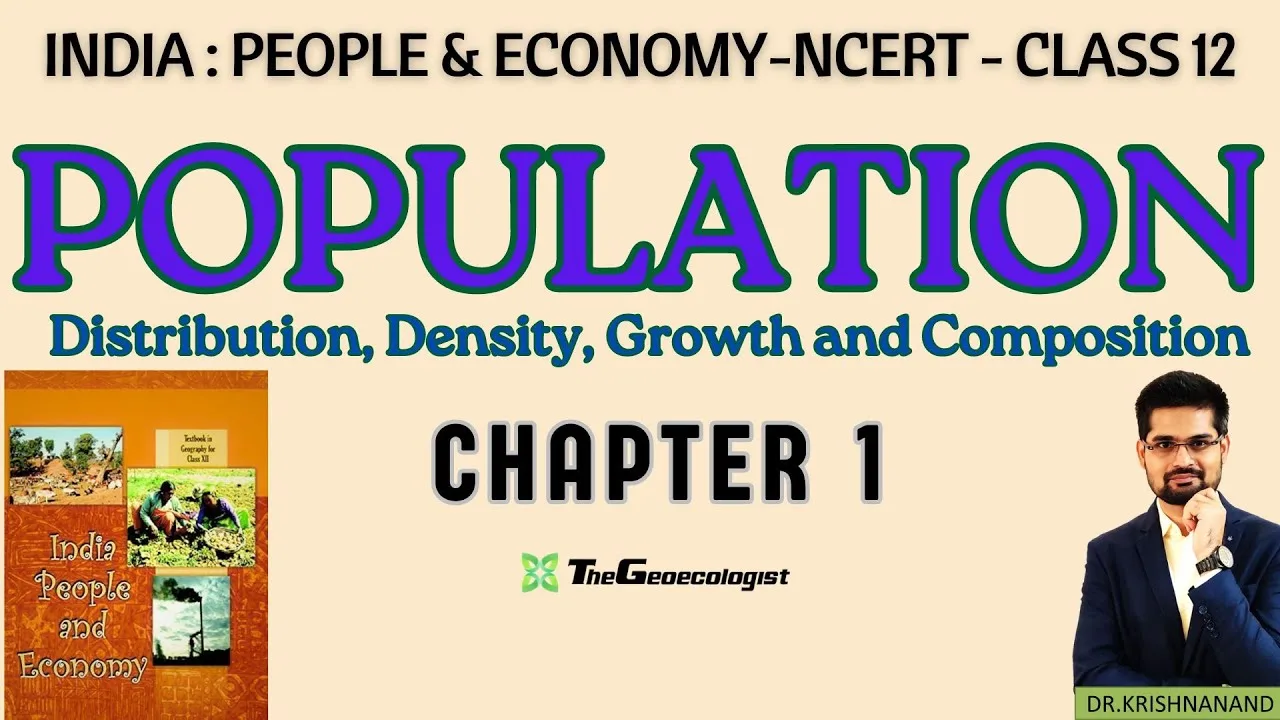
Table of Contents
- Understanding Population Distribution India
- Physical Factors Influencing Population Distribution India
- Socio‑economic Factors Influencing Population Distribution India
- Population Density: Measuring Concentration
- Population Growth Trends in India
- Population Composition: Age, Sex Ratio, Literacy, Occupation
- Government Initiatives and Policies
- Why This Chapter Matters for Exams
- Study Tips and Resources
- Conclusion
Population Distribution India is a fundamental concept that explains how people are spread across the country’s vast landscape. Understanding Population Distribution India helps students grasp regional disparities, economic potentials, and policy implications. In this article, we explore the nuances of Population Distribution India, density patterns, growth trends, and compositional characteristics as outlined in the Class 12 NCERT Geography textbook.
- Population Distribution India reveals uneven settlement with high concentrations in fertile plains and urban centers.
- Density metrics highlight stark contrasts between states like Bihar and Arunachal Pradesh.
- Growth trends show a transition from high fertility to declining rates, influencing the demographic dividend.
- Composition analysis covers age structure, sex ratio, literacy, and occupational shifts.
- Government policies aim to stabilize population while leveraging the youthful workforce.
Understanding Population Distribution India
Population Distribution India refers to the spatial arrangement of the nation’s inhabitants across its 28 states and 8 union territories. According to the Census of India, the 2011 data indicated that approximately 16.9% of the total population resided in Uttar Pradesh alone, making it the most populous state. Maharashtra and Bihar followed with significant shares. Conversely, the Himalayan states such as Sikkim, Arunachal Pradesh, and Himachal Pradesh, along with the arid zones of Rajasthan, exhibited low population shares due to challenging topography and limited economic opportunities.
Physical Factors Influencing Population Distribution India
The physical landscape plays a decisive role in shaping Population Distribution India. Fertile alluvial soils of the Indo‑Gangetic plain support intensive agriculture, attracting large populations. River systems like the Ganges, Brahmaputra, and Godavari provide water for irrigation and domestic use, reinforcing settlement. Climate also matters: moderate temperatures and adequate rainfall in the plains and coastal zones favor habitation, whereas extreme cold in the Himalayas and arid conditions in the Thar Desert discourage dense settlement.
Socio‑economic Factors Influencing Population Distribution India
Beyond geography, human‑driven factors significantly affect Population Distribution India. Urbanization pulls migrants toward cities such as Mumbai, Delhi, Bengaluru, and Chennai in search of employment, education, and healthcare. Industrial corridors along the Mumbai‑Pune belt and the Delhi‑Mumbai industrial zone create job magnets. Infrastructure development—railways, highways, and ports—enhances accessibility, further influencing where people choose to live. Government initiatives like smart city projects and special economic zones also reshape distribution patterns.
Population Density: Measuring Concentration
Population Density India quantifies the number of persons per square kilometre, offering a clear picture of concentration. The national average stood at 382 persons/sq.km according to the 2011 Census. States with the highest density include Bihar (1,102/sq.km), West Bengal (1,029/sq.km), and Kerala (860/sq.km), reflecting fertile land, intensive agriculture, and urban sprawl. At the other extreme, Arunachal Pradesh records a mere 17 persons/sq.km, while Mizoram and Sikkim remain under 50/sq.km due to rugged terrain and limited economic bases.
Notably, Delhi’s density exceeds 11,000 persons/sq.km, a testament to relentless urban migration and the city‑state’s role as a political and economic hub. Such extreme concentrations pose challenges for infrastructure, housing, and environmental sustainability, topics frequently examined in competitive exams.
Population Growth Trends in India
Population Growth India has undergone distinct phases since the early twentieth century. From 1901 to 1921, growth was stagnant due to high birth and death rates exacerbated by famines and influenza. The period 1921–1951 witnessed steady growth as public health interventions and disease control lowered mortality. The era 1951–1981 marked rapid expansion, fueled by the Green Revolution, medical advances, and declining death rates while birth rates remained high. Post‑1981, growth rates began to decline owing to increased literacy, urbanization, and family‑planning initiatives.
India is currently positioned in Stage 3 of the demographic transition model, where both birth and death rates are falling, leading to a gradual slowdown in population increase. The 2011 Census recorded a decadal growth rate of 17.7%, down from 21.5% in 2001. States like Kerala and Tamil Nadu exhibit low growth rates (below 10% per decade) due to high literacy and robust healthcare, whereas Bihar, Uttar Pradesh, and Madhya Pradesh still experience higher growth.
Population Composition: Age, Sex Ratio, Literacy, Occupation
Understanding Population Composition India provides insights into the socio‑economic fabric. The age structure reveals a youthful population: over 50% of Indians are under 25 years old, presenting both opportunities for a demographic dividend and challenges in job creation. The sex ratio stood at 943 females per 1,000 males in 2011, with Kerala leading at 1,084 and Haryana lagging at 879, reflecting deep‑rooted gender disparities.
Literacy rates have improved markedly, reaching 74% overall in 2011. Kerala tops the list with 93.9% literacy, while Bihar trails at 63.8%. Occupational structure shows that about 54% of the workforce remains engaged in the primary sector (agriculture), though the secondary and tertiary sectors are expanding rapidly due to urbanization and industrial growth.
Government Initiatives and Policies
Recognizing the implications of Population Distribution India, the government has launched several policies. The National Population Policy (2000) aimed to achieve a stable population by 2045 through investments in education, health, and women’s empowerment. Programs such as Beti Bachao Beti Padhao and Sukanya Samriddhi Yojana address gender imbalance and promote female education. The Pradhan Mantri Jan Arogya Yojana (PM‑JAY) seeks to improve healthcare access, indirectly influencing mortality and fertility trends.
Why This Chapter Matters for Exams
For CBSE board exams, CUET, UPSC, and UGC NET, mastering Population Distribution India is essential. Questions often focus on interpreting density maps, comparing state‑wise statistics, and explaining the factors behind regional disparities. Aspirants must be able to link distribution patterns to economic development, policy outcomes, and environmental sustainability. A clear grasp of demographic transition and composition indicators enables candidates to tackle analytical and application‑based questions with confidence.
Study Tips and Resources
To excel, students should:
- Create comparative tables of density, growth rate, and literacy for major states.
- Use thematic maps from the Census of India website to visualize Population Distribution India.
- Watch explanatory videos that break down the demographic transition model with Indian examples.
- Practice previous‑year questions that ask for reasons behind high/low density in specific regions.
- Refer to standard references like India: People and Economy (NCERT Class 12) and supplementary books such as Human Geography by Majid Husain.
Conclusion
Population Distribution India is more than a statistical concept; it is a lens through which we understand the country’s socio‑economic dynamics, regional inequalities, and future prospects. By examining distribution, density, growth, and composition, students gain a holistic view that is invaluable for academic success and informed citizenship. As India continues to evolve, the insights from this chapter will remain relevant for policymakers, researchers, and anyone keen on grasping the forces shaping the nation’s destiny.
Frequently Asked Questions
Questions on Population Distribution India frequently appear in CBSE, CUET, UPSC, and UGC NET exams, testing candidates ability to interpret density maps, explain regional disparities, and link distribution to economic development and policy outcomes.
According to the 2011 Census, Bihar has the highest density at 1,102 persons/sq.km, while Arunachal Pradesh records the lowest at just 17 persons/sq.km.
India is in Stage 3 of the demographic transition model, where declining birth and death rates lead to a slowing growth rate, reflecting increased literacy, urbanization, and effective family planning measures.