
Blog
Bihar Population Problems: Demographic Profile, Migration Crisis & BPSC Exam Guide

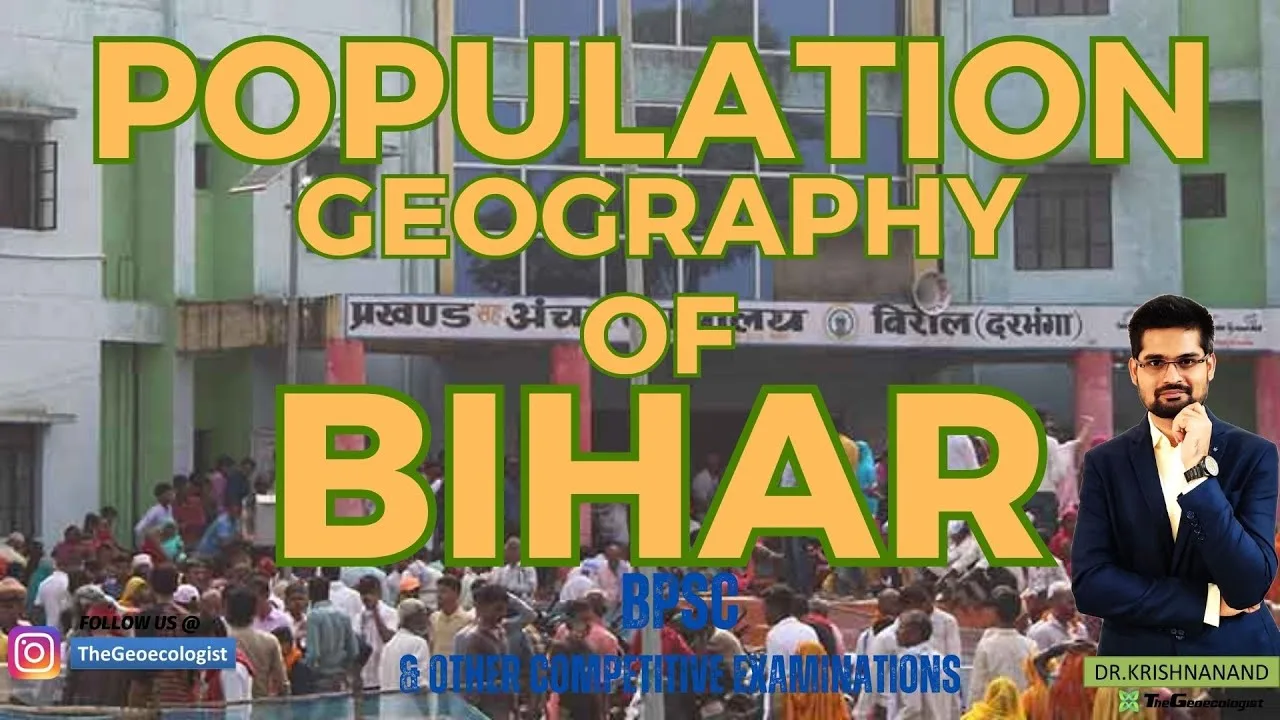
Table of Contents
- Understanding Bihar Population Problems: Historical Context & Current Reality
- District-Level Disparities in Demographic Indicators
- Migration Crisis: The Human Face of Bihar Population Problems
- Push Factors Driving Out-Migration
- Consequences: Remittance Dependency & Social Costs
- Government Interventions Addressing Bihar Population Problems
- Demographic & Health Initiatives
- Migration-Specific Policies
- Urbanization & Infrastructure Push
- BPSC Exam Relevance: How Bihar Population Problems Feature in Competitive Exams
- Future Trajectory: Can Bihar Turn Population Problems into Dividend?
- Key Data Reference Table for Quick Revision
- Conclusion: From Liability to Asset
Bihar population problems represent one of India’s most complex demographic challenges, with the state’s 124 million residents (2021 estimate) grappling with extreme density, rapid growth, and massive out-migration that reshapes both local communities and destination states. As the third-most populous state after Uttar Pradesh and Maharashtra, Bihar’s demographic trajectory directly impacts national development indicators, making it a critical subject for BPSC aspirants, policymakers, and development economists alike.
- Extreme density: 1,106 persons/km² (2011 Census) — nearly 3× the national average of 382
- Youth bulge: 58% population under 25 years — a demographic dividend at risk without skill development
- Migration scale: Estimated 10–12 million seasonal/permanent migrants — among India’s highest out-migration rates
- Gender gap: Sex ratio 918 females/1,000 males; female literacy 53.3% vs. national 64.6%
- Urbanization lag: Only 11.3% urban (2011) vs. 31.2% national average — weak urban infrastructure
Understanding Bihar Population Problems: Historical Context & Current Reality
The Bihar population problems have deep historical roots. During British colonial rule, the region (then part of Bengal Presidency) experienced recurrent famines — notably the 1770 Bengal famine and 1873–74 Bihar famine — that devastated demographics. Post-independence, the state’s growth rate accelerated dramatically: from 21.5% decadal growth (1951–61) to 28.6% (1991–2001), before moderating to 25.4% in 2001–2011. This trajectory reflects the classic demographic transition lag where mortality declines precede fertility decline.
According to the Office of the Registrar General & Census Commissioner, India, Bihar’s Total Fertility Rate (TFR) stood at 3.2 in NFHS-5 (2019–21), still above replacement level (2.1) though down from 4.0 in NFHS-3 (2005–06). The state’s Crude Birth Rate (26.8) and Crude Death Rate (5.8) in 2020 (SRS Bulletin) indicate continued natural increase. These Bihar population problems are compounded by early marriage — 40.8% women aged 20–24 married before 18 (NFHS-5) — and low contraceptive prevalence (55.8% any method, NFHS-5).
District-Level Disparities in Demographic Indicators
Not all districts face identical Bihar population problems. The Seemanchal region (Kishanganj, Araria, Purnia, Katihar) records TFR above 3.5 and female literacy below 45%, while Patna, Munger, and Rohtas show TFR near 2.5 and female literacy above 65%. This intra-state variation demands targeted policy interventions rather than one-size-fits-all approaches. The 2011 Census revealed that 28 of 38 districts had density exceeding 1,000 persons/km², with Sheohar (1,882) and Vaishali (1,717) topping the list.
Migration Crisis: The Human Face of Bihar Population Problems
Migration is both a symptom and a coping mechanism for Bihar population problems. The Bihar Migration Survey 2021 (commissioned by the Labour Resources Department) estimated 10.7 million migrants from Bihar — approximately 9% of the state’s population. Of these, 65% were seasonal/circular migrants (6–8 months annually), primarily in construction, brick kilns, agriculture, and domestic work across Punjab, Haryana, Delhi, Maharashtra, and Gujarat.
Push Factors Driving Out-Migration
- Agrarian distress: 76% workforce in agriculture (PLFS 2020–21) but average holding size 0.39 ha (Agriculture Census 2015–16) — 70% marginal holdings (<1 ha). Low productivity (rice yield 2.4 t/ha vs. Punjab's 4.1) and lack of irrigation (61% net irrigated area) suppress incomes.
- Industrial vacuum: Bihar contributes <1.5% to India's manufacturing GSVA. Only 3,200 factories (ASI 2019–20) employ 1.1 lakh workers — negligible for a 124-million population.
- Wage differentials: MGNREGA wage in Bihar ₹210/day (2023) vs. ₹350–450 in Punjab construction. Annual remittances estimated at ₹30,000–40,000 crore (World Bank/Knowledge Partnership).
Consequences: Remittance Dependency & Social Costs
The Bihar population problems create a remittance-dependent economy. NSSO 77th Round (2019) data shows 34% rural Bihar households receive remittances — averaging ₹48,000/year — funding consumption, healthcare, and education. However, this creates vulnerability: the 2020 COVID lockdown stranded 2.5+ million Bihar migrants, exposing precarious working conditions, lack of social security portability, and exclusion from destination-state welfare schemes.
Seasonal migration disrupts children’s education — ASER 2022 found 18% children in migrant households (age 6–14) not enrolled vs. 3% non-migrant. Women left behind face increased agricultural workload, limited decision-making, and vulnerability to exploitation. The “brain drain” of skilled professionals — engineers, doctors, IT workers — to Bengaluru, Hyderabad, and NCR further depletes local human capital.
Government Interventions Addressing Bihar Population Problems
Demographic & Health Initiatives
- Mission Parivar Vikas: Launched 2017 in 37 high-TFR districts — focuses on contraceptive access, spacing methods, and community engagement. TFR declined from 3.4 (NFHS-4) to 3.2 (NFHS-5) in target districts.
- Jeevika (Bihar Rural Livelihoods Promotion Society): 1.2 crore women in 10 lakh SHGs (2023) — enhances financial inclusion, livelihood diversification, and women’s agency. World Bank rates it among India’s most effective SHG programs.
- Kishori Shakti Yojana & SABLA: Target adolescent girls’ nutrition, health awareness, and skill training to delay marriage.
Migration-Specific Policies
- Bihar Migration Survey (2021): First comprehensive state-led enumeration — mapped corridors, skill profiles, and distress indicators. Data now informs Bihar Migrant Workers Welfare Board (est. 2022).
- Kushal Yuva Program: 15-lakh youth trained (2016–2023) in soft skills, IT, and domain skills — placement rate ~45%.
- Inter-state coordination: MoUs with Punjab, Maharashtra, Delhi for migrant welfare — portable PDS (One Nation One Ration Card), health insurance (Ayushman Bharat), and grievance redressal.
Urbanization & Infrastructure Push
Recognizing low urbanization as a Bihar population problems amplifier, the state launched Mukhyamantri Shahri Peyjal Nishchay Yojana (urban water supply), Smart City Mission (Patna, Bhagalpur, Biharsharif, Muzaffarpur), and AMRUT 2.0 for 42 towns. However, urban planning capacity remains weak — only 12% towns have master plans (TCPO 2021).
BPSC Exam Relevance: How Bihar Population Problems Feature in Competitive Exams
For BPSC aspirants, Bihar population problems are a recurring theme across General Studies papers. Analysis of 2018–2023 question papers reveals:
- Prelims: 3–5 questions annually on Census 2011 data, NFHS indicators, migration corridors, and scheme objectives (Jeevika, Kushal Yuva, Mission Parivar Vikas).
- Mains GS Paper I: Essay/long-answer on “Demographic dividend vs. disaster in Bihar,” “Migration as development strategy,” or “Gender dimensions of Bihar’s population policy.”
- Mains GS Paper II: Governance questions on inter-state migrant coordination, social security portability, and center-state fiscal relations for high-migration states.
- Optional (Geography/Sociology/PubAd): Case studies on Bihar’s demographic transition, regional disparities, and policy evaluation.
Dr. Krishnanand’s Geography of Bihar course (TheGeoecologist) specifically addresses these patterns using district-level maps, NFHS/SRS data tables, and previous-year question analysis — a high-ROI resource for serious aspirants.
Future Trajectory: Can Bihar Turn Population Problems into Dividend?
The Bihar population problems narrative is not predetermined. NFHS-5 shows fertility declining faster than national average (TFR drop 0.8 points 2015–2021 vs. 0.5 nationally). If Bihar achieves replacement-level fertility by 2030 (projected by UN Population Division), the working-age population share will peak at 65% around 2040 — a 20-year window for demographic dividend.
Realizing this requires:
- Education quality: ASER 2022 shows only 42% Class V children can read Class II text — foundational learning must improve.
- Industrial policy: Leverage agro-processing (makhana, litchi, maize), textiles, and leather — sectors with comparative advantage and labor absorption.
- Urban governance: Empower ULBs with finances, functionaries, and functions (3Fs) to manage inevitable urbanization.
- Migration governance: Institutionalize the Migration Resource Centers piloted in 10 districts — provide pre-departure training, legal aid, and reintegration support.
Key Data Reference Table for Quick Revision
| Indicator | Bihar (Latest) | India (Latest) | Source/Year |
|---|---|---|---|
| Population | ~124 million | 1.42 billion | World Bank / 2021 est. |
| Density (persons/km²) | 1,106 | 382 | Census 2011 |
| Decadal Growth (2001–11) | 25.4% | 17.7% | Census 2011 |
| TFR | 3.2 | 2.0 | NFHS-5 (2019–21) |
| Sex Ratio (females/1000 males) | 918 | 1,020 | Census 2011 |
| Female Literacy | 53.3% | 64.6% | Census 2011 |
| Urbanization % | 11.3% | 31.2% | Census 2011 |
| Out-migrants (est.) | 10.7 million | 450 million (internal) | Bihar Migration Survey 2021 |
| Remittances (est. annual) | ₹30–40K crore | ₹87K crore (internal, 2007–08 NSSO) | World Bank / State estimates |
Conclusion: From Liability to Asset
Bihar population problems are not merely statistics — they represent millions of individual aspirations constrained by structural deficits. The state’s demographic trajectory will significantly influence India’s achievement of SDGs (particularly Goals 1, 3, 4, 5, 8, 10, 11). For BPSC aspirants, mastering this topic means understanding not just data points but the interplay of history, geography, political economy, and governance. The path forward lies in converting Bihar’s greatest liability — its youthful, dense, mobile population — into its greatest asset through education, industrialization, and humane migration governance. As the Wikipedia entry on Bihar notes, the state’s ancient legacy as a center of learning (Nalanda, Vikramashila) and governance (Maurya, Gupta empires) offers civilizational proof that demographic scale, when harnessed, can build extraordinary civilizations.
Frequently Asked Questions
Bihar's population density is 1,106 persons per sq km (Census 2011), nearly three times the national average of 382 persons per sq km, making it India's most densely populated major state.
The Bihar Migration Survey 2021 estimated 10.7 million migrants from Bihar, with 65% engaged in seasonal/circular migration to Punjab, Haryana, Delhi, Maharashtra, and Gujarat for construction, brick kilns, agriculture, and domestic work.
Key schemes include Mission Parivar Vikas (fertility reduction), Jeevika (women's SHGs), Kushal Yuva Program (skill development), Bihar Migration Survey 2021, and the Bihar Migrant Workers Welfare Board (2022) for migrant protection and portability of benefits.