Blog
Map Projection: Why Greenland Looks as Big as Africa on World Maps

Table of Contents
- The Fundamental Problem: Flattening a Sphere
- Why Map Projection Matters Beyond Cartography
- The Mercator Map Projection: Navigation's Gift, Geography's Curse
- Greenland vs. Africa: The Numbers Behind the Illusion
- Alternative Map Projection Types and Their Trade-offs
- Equal-Area Map Projection Options
- Compromise Map Projection Types
- Specialized Map Projection Applications
- Map Projection in the Digital Age: Web Mercator's Dominance
- Can Digital Maps Solve the Map Projection Problem?
- Educational Implications: Teaching Map Projection Literacy
- Map Projection in GIS and Data Science
- Choosing the Right Map Projection: A Decision Framework
- The Future of Map Projection: Beyond Static Choices
- Conclusion: Map Projection as Critical Geographic Literacy
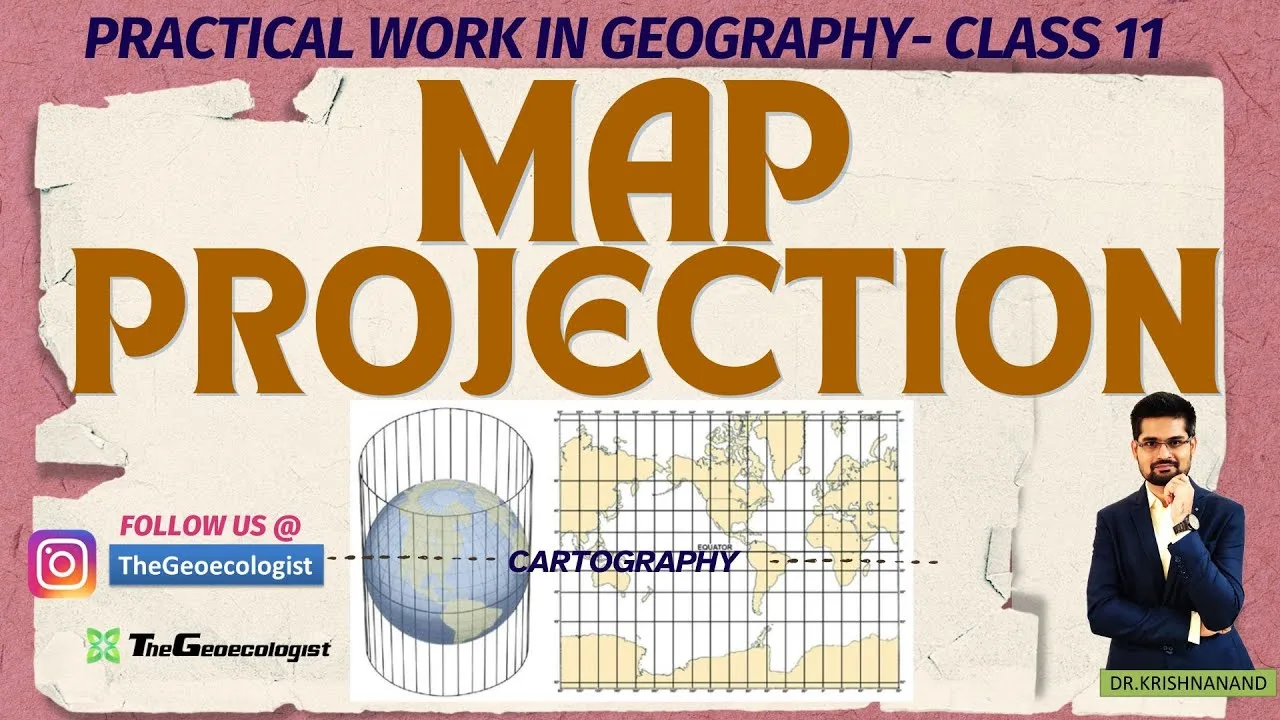
Understanding map projection is essential for anyone who has ever looked at a world map and wondered why Greenland appears nearly the same size as Africa, when in reality Africa is about 14 times larger. This fundamental cartographic challenge arises because our three-dimensional Earth cannot be perfectly flattened onto a two-dimensional surface without introducing distortions in area, shape, distance, or direction. The map projection you choose determines which properties are preserved and which are sacrificed, making this concept critical for geographers, navigators, educators, and anyone interpreting spatial data.
- Map projection is the systematic transformation of the Earth’s curved surface onto a flat plane, inevitably creating distortions.
- The Mercator map projection, created in 1569, preserves angles and shapes for navigation but dramatically exaggerates polar regions.
- Greenland (2.16 million km²) appears similar to Africa (30.37 million km²) on Mercator maps, though Africa is actually 14 times larger.
- Equal-area map projection types like Gall-Peters preserve relative sizes but distort shapes.
- No single map projection can perfectly represent all geographic properties simultaneously.
- Modern digital mapping platforms like Google Maps use Web Mercator, inheriting the same polar distortion issues.
- Understanding map projection choices is crucial for accurate data interpretation in GIS, education, and policy-making.
The Fundamental Problem: Flattening a Sphere
Imagine trying to peel an orange and lay the peel flat on a table without tearing it. It’s impossible — the curved surface must stretch, compress, or tear to become planar. This is the core challenge of every map projection. The Earth is an oblate spheroid, roughly spherical but slightly flattened at the poles. When cartographers create a map projection, they must decide which geographic properties to preserve: area (equivalence), shape (conformality), distance (equidistance), or direction (azimuthality). Mathematically, it has been proven since Gauss’s Theorema Egregium (1827) that no map projection can preserve all these properties simultaneously. This isn’t a limitation of technology or technique — it’s a fundamental geometric truth.
Why Map Projection Matters Beyond Cartography
The choice of map projection isn’t merely academic. It shapes how billions of people perceive the world. When children grow up seeing Greenland loom as large as Africa on classroom walls, they internalize a distorted mental map of global geography. This has real consequences: former colonies near the equator appear smaller and potentially less significant, while northern nations appear disproportionately large. The map projection becomes a subtle tool of geopolitical perception. In 1989, seven North American geographic organizations adopted a resolution recommending against rectangular map projection types for general-purpose world maps, specifically citing the Mercator’s misleading representation of relative sizes.
The Mercator Map Projection: Navigation’s Gift, Geography’s Curse
Gerardus Mercator, a Flemish cartographer, introduced his eponymous map projection in 1569. His innovation was revolutionary for its time: a cylindrical map projection where all lines of constant bearing (rhumb lines) appear as straight segments. This meant sailors could plot a course with a straight edge on the map and maintain a constant compass heading — a massive practical advantage for the Age of Exploration. The Mercator map projection is conformal, preserving local angles and shapes, making it ideal for marine navigation. However, this comes at a steep cost: area distortion increases dramatically toward the poles. The scale factor at latitude φ is secant(φ), meaning at 60° latitude, areas are inflated by 2x; at 80°, by 5.76x; at 85°, by 11.5x. Greenland sits mostly between 60°N and 83°N, placing it in the zone of extreme exaggeration.
Greenland vs. Africa: The Numbers Behind the Illusion
Let’s examine the concrete data. Greenland’s land area is approximately 2,166,086 square kilometers. Africa’s land area is approximately 30,370,000 square kilometers. Africa is 14.02 times larger than Greenland. Yet on a standard Mercator map projection, they appear visually comparable. This happens because Greenland’s high latitude (centered around 72°N) subjects it to a scale factor of roughly 3.2, while Africa straddles the equator where the scale factor is 1.0. The visual result: Greenland’s 2.17 million km² gets stretched to appear roughly 7 million km² on the map, while Africa’s 30.37 million km² remains at its true scale. The map projection creates a lie that has persisted for centuries. Even today, a 2021 study published in The Cartographic Journal found that 68% of university students underestimated Africa’s size relative to Greenland when shown a Mercator map projection.
Alternative Map Projection Types and Their Trade-offs
Cartographers have developed hundreds of map projection types, each optimizing for different use cases. Understanding these alternatives reveals why the Mercator map projection persists despite its flaws.
Equal-Area Map Projection Options
Equal-area (or equivalent) map projection types preserve relative sizes at the expense of shape. The Gall-Peters map projection, introduced by James Gall in 1855 and popularized by Arno Peters in 1974, became famous for its political implications. Peters argued that the Mercator map projection was “Eurocentric” and that his map projection restored dignity to equatorial nations by showing their true size. The Gall-Peters map projection stretches the map vertically near the equator and compresses it near the poles, making Africa dominate the visual field as it should. However, shapes are severely distorted — continents appear elongated and unfamiliar. Other equal-area map projection types include the Mollweide (1805), Hammer-Aitoff (1892), and the more recent Equal Earth map projection (2018), which balances aesthetic appeal with mathematical rigor.
Compromise Map Projection Types
Compromise map projection types don’t perfectly preserve any single property but minimize overall distortion. The Robinson map projection (1963) was designed “to look right” rather than satisfy a mathematical constraint. It became the National Geographic Society’s standard world map projection from 1988 to 1998. The Winkel Tripel map projection (1921), adopted by National Geographic in 1998, minimizes the sum of area, angle, and distance distortion. These map projection types are widely considered superior for general-purpose world maps because they present a more balanced view. The Natural Earth map projection (2012) and Patterson map projection (2014) are newer entries optimized for digital display.
Specialized Map Projection Applications
Different map projection types serve specific needs. The Universal Transverse Mercator (UTM) system divides the world into 60 zones, each using a transverse Mercator map projection optimized for that longitudinal strip. This is the standard for military, surveying, and GIS applications requiring high local accuracy. The Lambert Conformal Conic map projection is standard for aeronautical charts across mid-latitudes. The Azimuthal Equidistant map projection preserves distances and directions from a central point, making it ideal for polar maps and radio communication planning. Each map projection is a tool designed for a job — the error lies in using a navigation map projection as a general reference map.
Map Projection in the Digital Age: Web Mercator’s Dominance
When Google Maps launched in 2005, it adopted a variant of the Mercator map projection called Web Mercator (EPSG:3857). This map projection treats the Earth as a perfect sphere rather than an ellipsoid, simplifying tile calculations for the quadtree-based tile pyramid that powers slippy maps. OpenStreetMap, Bing Maps, Mapbox, and virtually every major web mapping platform followed suit. Today, billions of people interact with this map projection daily. The technical convenience is undeniable: square tiles, simple zoom logic, and conformality at local scales make Web Mercator ideal for street-level navigation. But at global scales, it inherits all the Mercator map projection‘s distortions. A 2020 analysis by the Cartography and Geographic Information Society noted that Web Mercator has become the de facto default map projection for an entire generation, reinforcing the Greenland-Africa illusion at planetary scale.
Can Digital Maps Solve the Map Projection Problem?
Modern web mapping libraries like MapLibre GL, OpenLayers, and Leaflet support dynamic map projection switching. Google Earth uses a 3D globe view by default, sidestepping map projection issues entirely. However, the 2D map view remains Web Mercator. Some platforms experiment with adaptive map projection — showing a globe at low zoom and transitioning to a local conformal map projection at high zoom. The Mercator projection’s mathematical simplicity keeps it entrenched in the tile-based architecture that underpins the modern web map ecosystem. Changing this would require rebuilding the global tile pyramid — a massive undertaking. For now, the map projection that served 16th-century sailors still shapes 21st-century worldviews.
Educational Implications: Teaching Map Projection Literacy
The UPSC (Union Public Service Commission) and other competitive examinations in India frequently test map projection concepts, reflecting their importance in geographic literacy. The Geoecologist and similar educational channels emphasize “Understand Geography — Don’t Just Memorize It” because map projection literacy transforms passive map consumption into critical spatial thinking. Students should learn to ask: What map projection is this? What does it preserve? What does it distort? Who made it, and for what purpose? A 2019 National Geographic Society survey found that only 23% of American adults could identify the map projection used in a standard world map. This literacy gap matters — map projection choice affects climate change visualization, election mapping, disease spread tracking, and resource allocation decisions.
Map Projection in GIS and Data Science
In Geographic Information Systems (GIS), map projection management is foundational. Every spatial dataset has a coordinate reference system (CRS) defining its map projection. Mismatched CRS between layers causes misalignment — a classic GIS error. The EPSG Geodetic Parameter Dataset catalogs over 6,000 map projection definitions. Professionals must understand map projection properties to choose appropriately: equal-area for density mapping, conformal for boundary delineation, equidistant for buffer analysis. The rise of big spatial data — satellite imagery, GPS traces, IoT sensor networks — makes map projection competence more valuable than ever. A 2022 International Journal of Geographical Information Science paper demonstrated that map projection choice alone can alter spatial regression results by up to 40%, confirming that map projection isn’t just cosmetic — it’s analytical.
Choosing the Right Map Projection: A Decision Framework
Selecting a map projection requires matching the projection’s preserved properties to the map’s purpose. For navigation: conformal map projection (Mercator, Lambert Conformal Conic). For thematic mapping of densities or distributions: equal-area map projection (Albers, Mollweide, Equal Earth). For distance measurement from a point: azimuthal equidistant map projection. For general reference world maps: compromise map projection (Winkel Tripel, Robinson, Natural Earth). For polar regions: polar stereographic or azimuthal map projection. For continental-scale mapping: conic map projection types. The U.S. Geological Survey provides a map projection selection guide that remains a gold standard. No map projection is universally “best” — each is a compromise optimized for specific parameters.
The Future of Map Projection: Beyond Static Choices
Emerging technologies are changing how we think about map projection. Augmented reality (AR) and virtual reality (VR) can display geographic data on a virtual globe, eliminating the need for map projection entirely in immersive contexts. Dynamic map projection engines can morph between projections based on zoom level, region, and user interaction. Machine learning approaches are being explored to generate optimal map projection parameters for specific datasets and visualization goals. The U.S. Geological Survey now distributes data in multiple map projection formats simultaneously. As spatial computing evolves, the rigid choice of a single map projection may give way to adaptive, context-aware projection systems that preserve the right properties for the right task at the right scale.
Conclusion: Map Projection as Critical Geographic Literacy
The map projection is not a mere technical detail — it’s a lens that shapes our understanding of the planet. The Greenland-Africa illusion on the Mercator map projection is the most famous example, but every map projection tells a partial truth. By understanding map projection principles, we become critical consumers of spatial information rather than passive recipients of cartographic conventions. Whether you’re a student preparing for UPSC, a data scientist analyzing spatial patterns, a journalist mapping election results, or simply a curious citizen, map projection literacy empowers you to see the world more accurately. The next time you see a world map, ask: What map projection is this? What’s being stretched, compressed, or preserved? The answer reveals as much about the mapmaker’s intent as about the Earth itself.
Frequently Asked Questions
Greenland appears similar in size to Africa on Mercator projection maps because this map projection stretches areas near the poles. Greenland at high latitudes is inflated by a factor of 3-4x, while Africa at the equator is shown at true scale. In reality, Africa is 14 times larger than Greenland.
There is no single best map projection. For general reference, compromise projections like Winkel Tripel, Robinson, or Equal Earth balance area, shape, and distance distortion. For thematic mapping showing densities, equal-area projections like Mollweide or Albers are preferred. The choice depends on the map's purpose.
Yes, Google Maps uses Web Mercator (EPSG:3857), a spherical variant of the Mercator projection. This map projection simplifies tile-based rendering for web maps but inherits the same polar distortion, making Greenland and Antarctica appear vastly larger than they are.